
Here you will find further details about the different Reports which can be downloaded from the Analytics dashboards.
For E-Learning and Phishing Simulation we provide a general PDF report that includes the charts shown on the respective Analytics page as well as data reports in the form of Excel sheets or comma separated text files.
Report types
PDF
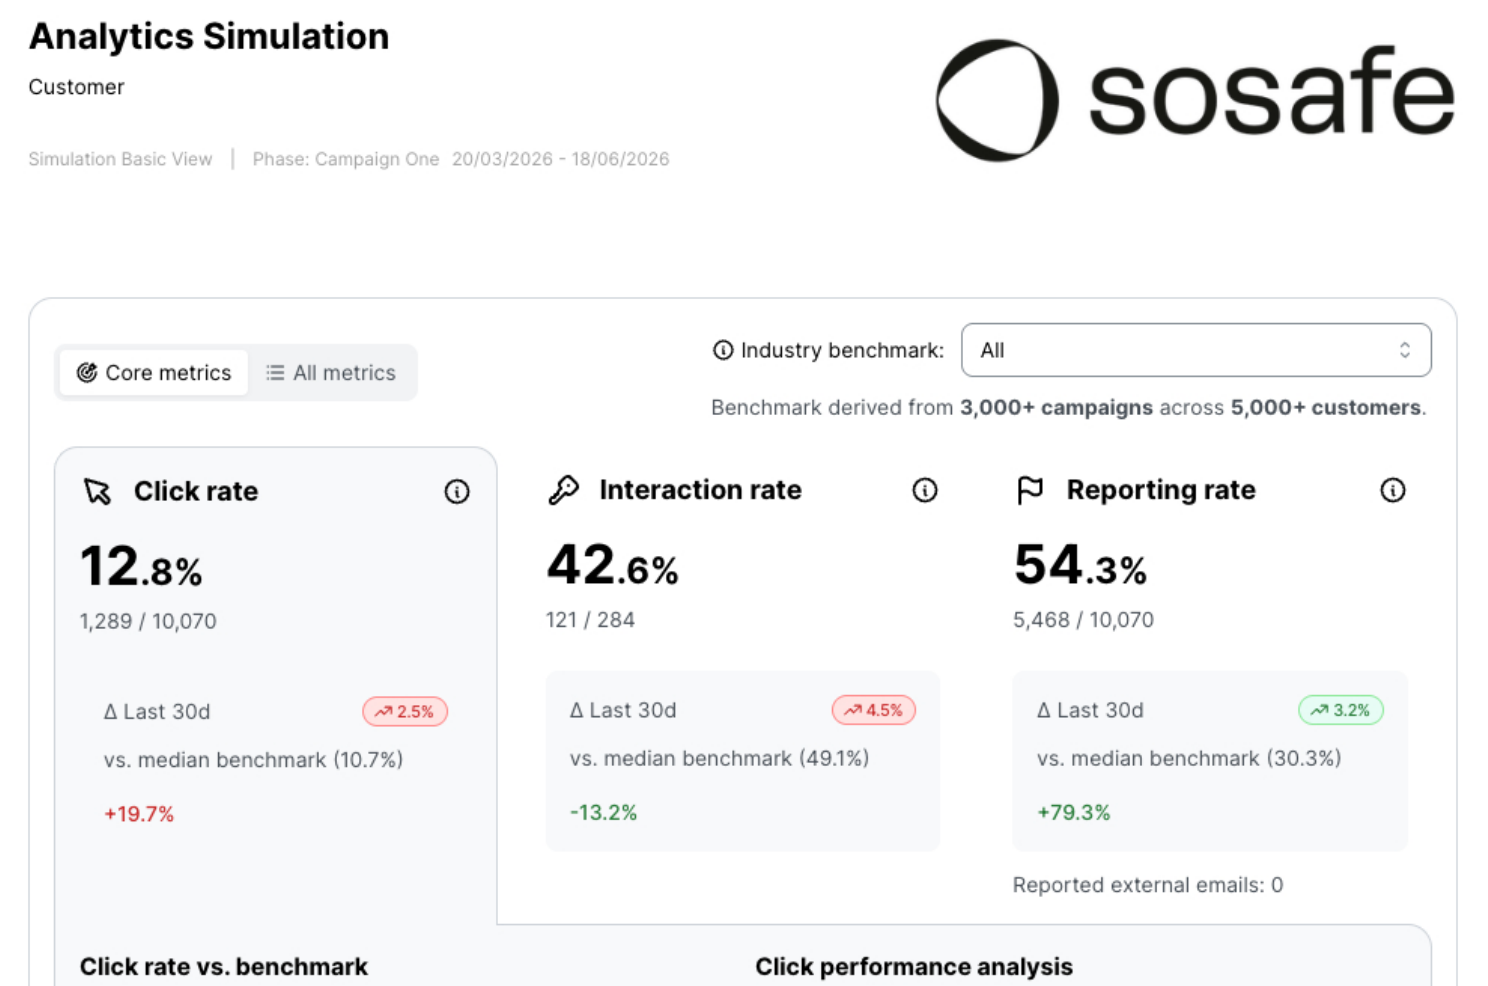
The PDF export is essentially your Analytics page as a single PDF document. It also features a legend at the bottom that explains the individual metrics briefly.
KPI data
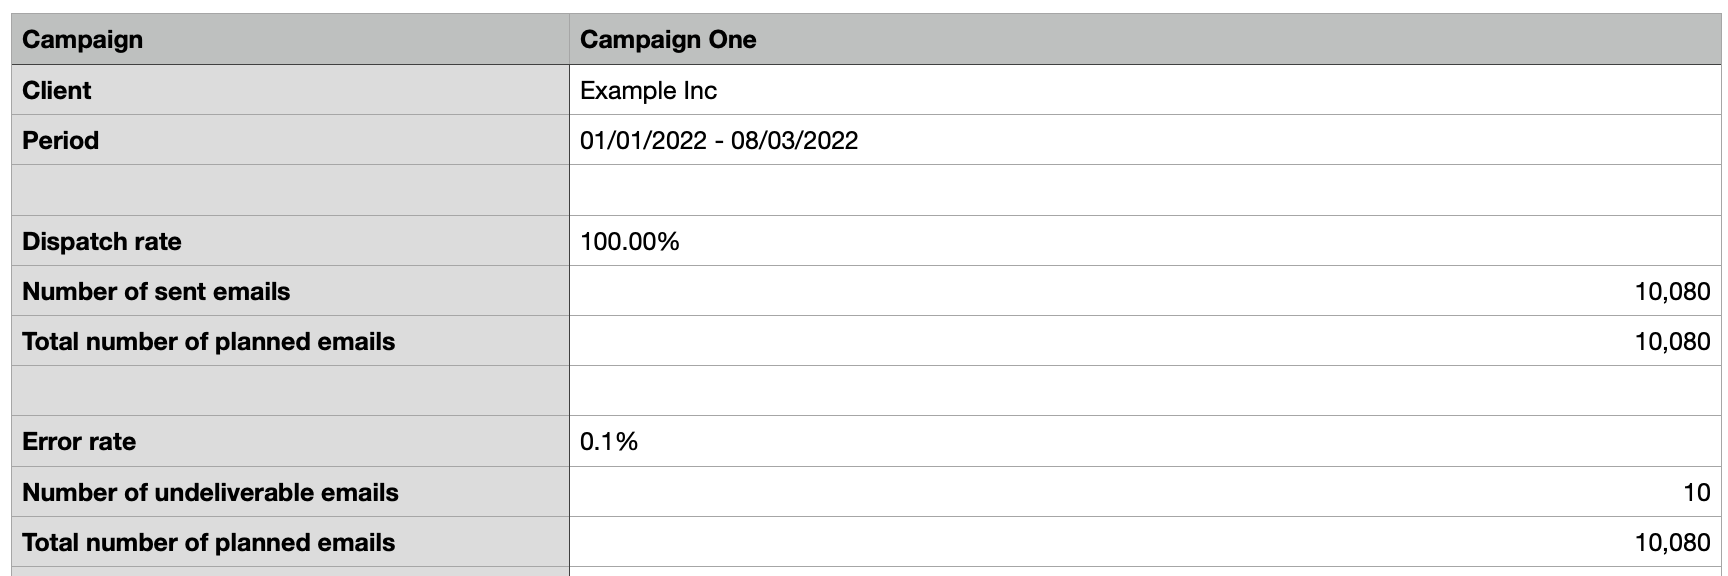
The KPI data export includes all important KPI data in a machine-readable file.
For Phishing Simulations, this includes the click rate, interaction rate, reporting rate, and many more. The file also contains template-specific data.
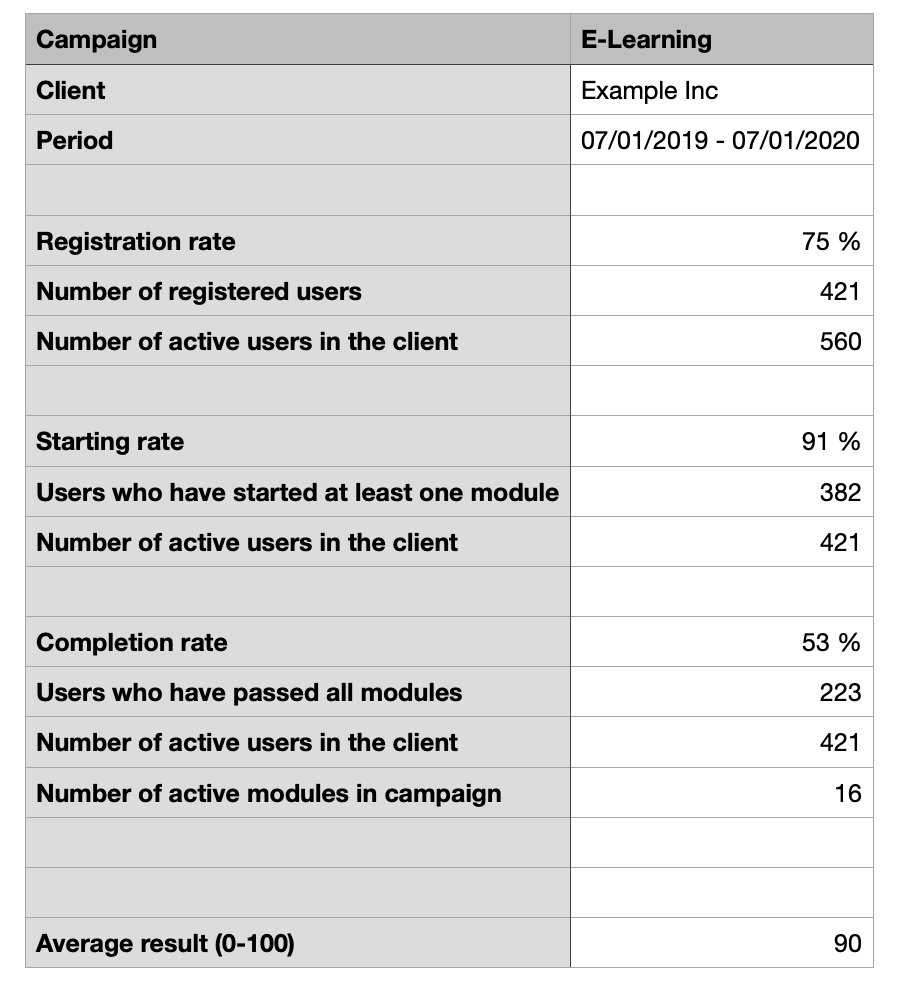
For E-Learning, this includes an overview of the campaigns you selected.
Data
Note: Depending on your data privacy settings, some data may not be available.
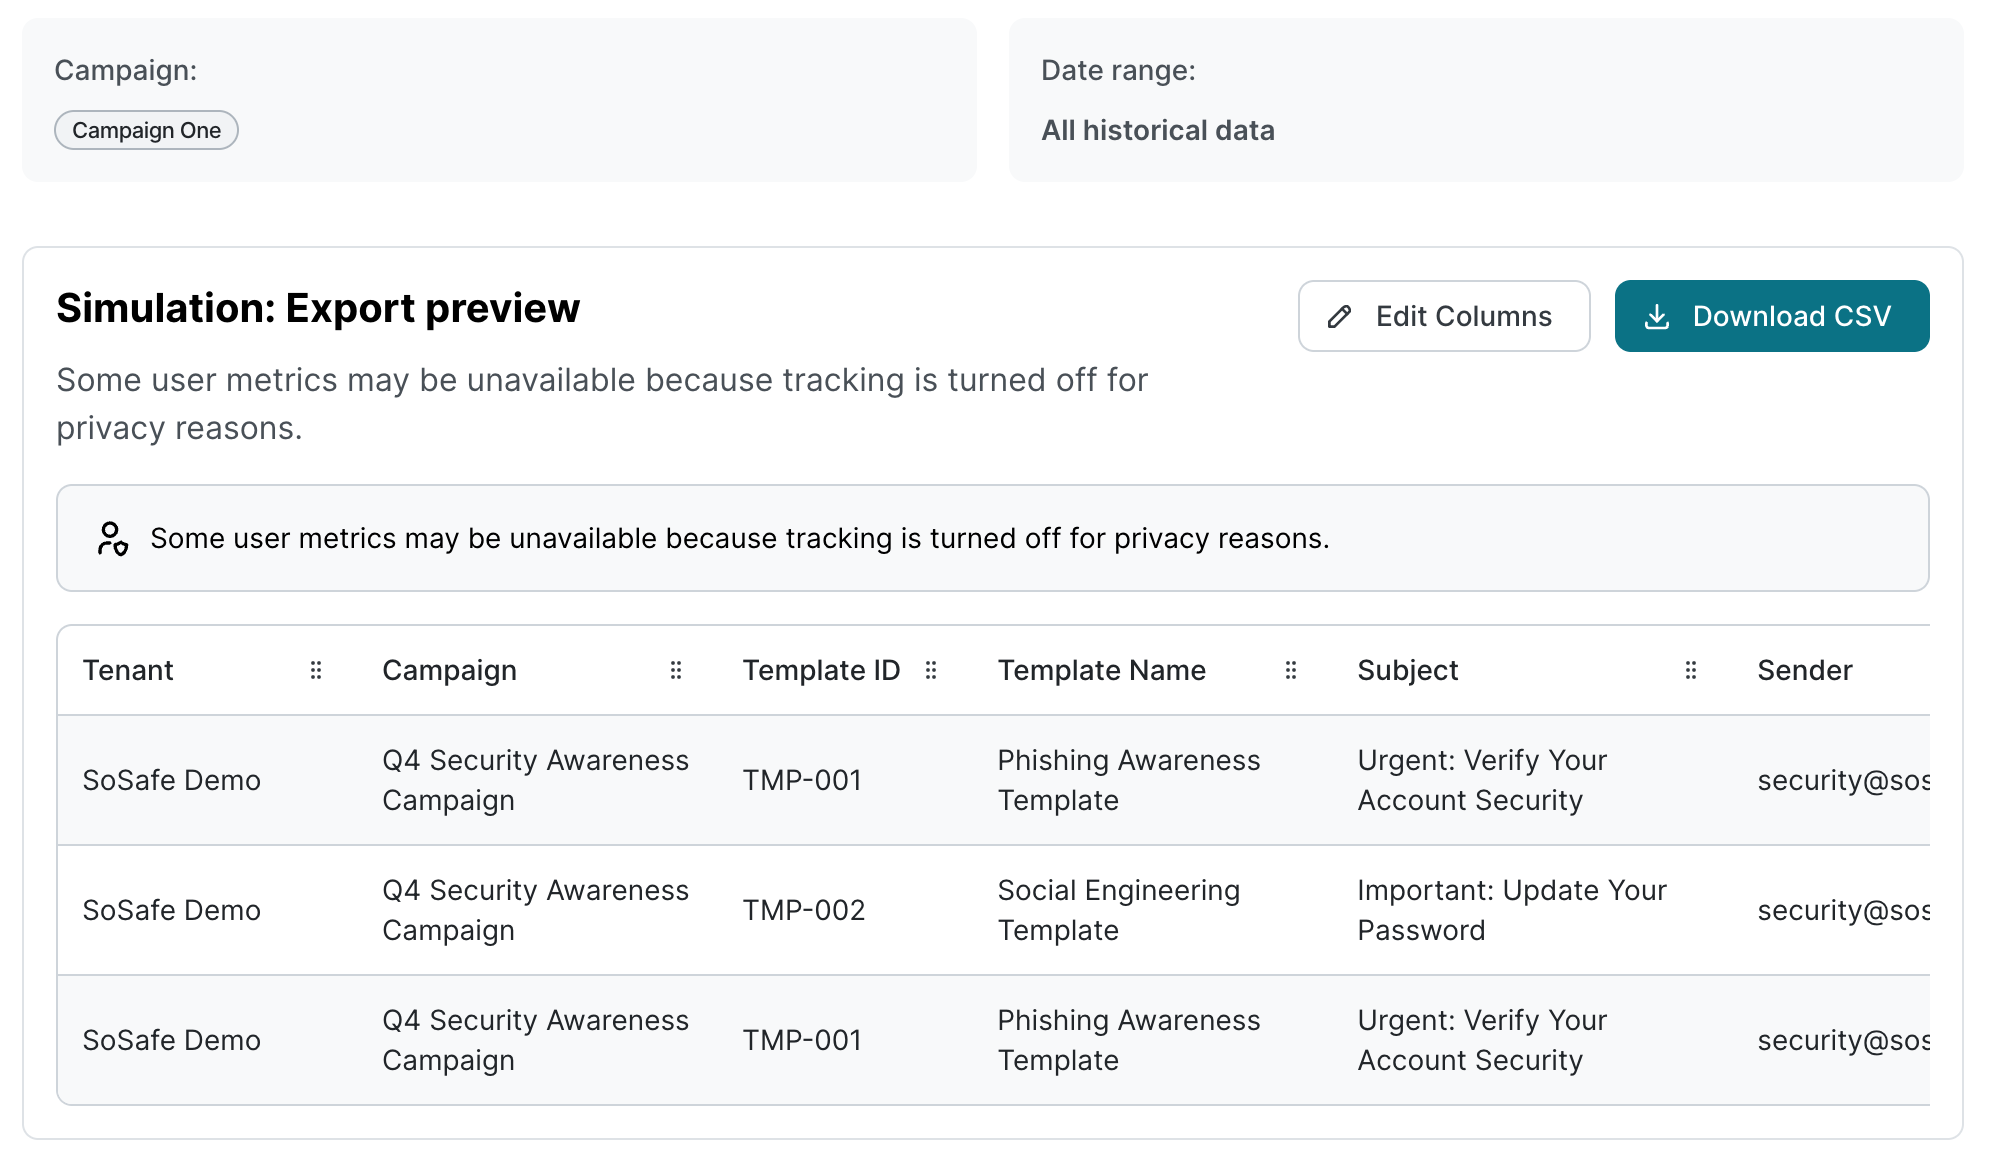
For Phishing Simulations, the raw data export includes all emails sent with full records of which template was used, which user group the recipient was in, when it was sent, how it was interacted with etc. See the screenshot below for an example.

For E-Learning, the raw data export includes all users from the selected campaigns alongside their learning progress.

How to download reports
The procedure for downloading reports is the same for E-Learning and Phishing Simulation Analytics and pretty simple.
-
Filter data by campaign and date range
By default, the Analytics will show your currently active campaign. This is shown below Phase. Select that box to select any campaigns you’re interested in or choose Cumulative to get all data.
In addition, you can apply a date filter. To do so, select the date picker below Date range.
For technical reasons, the date filter cannot be applied to E-Learning raw data exports. It works in all other scenarios.
-
Choose which type of report to download
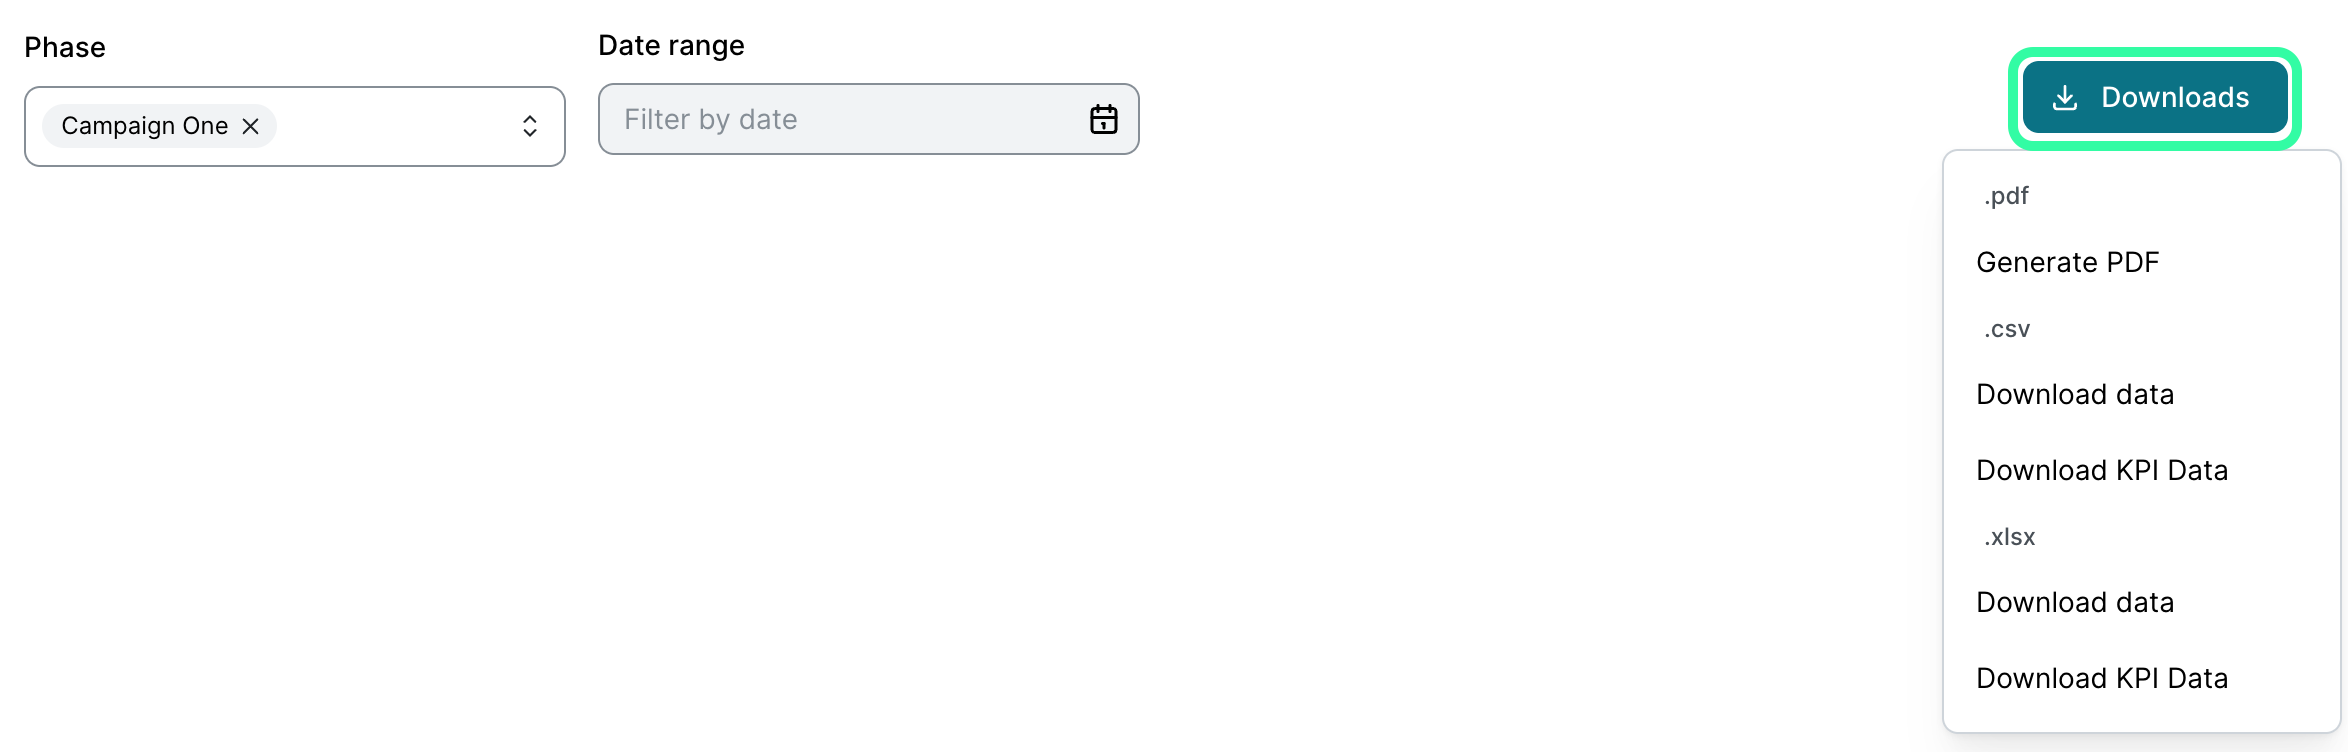
Select the Downloads button at the top right and a list of options will be shown. See the section above for more information about which information which type of report contains.
-
For Download data only:
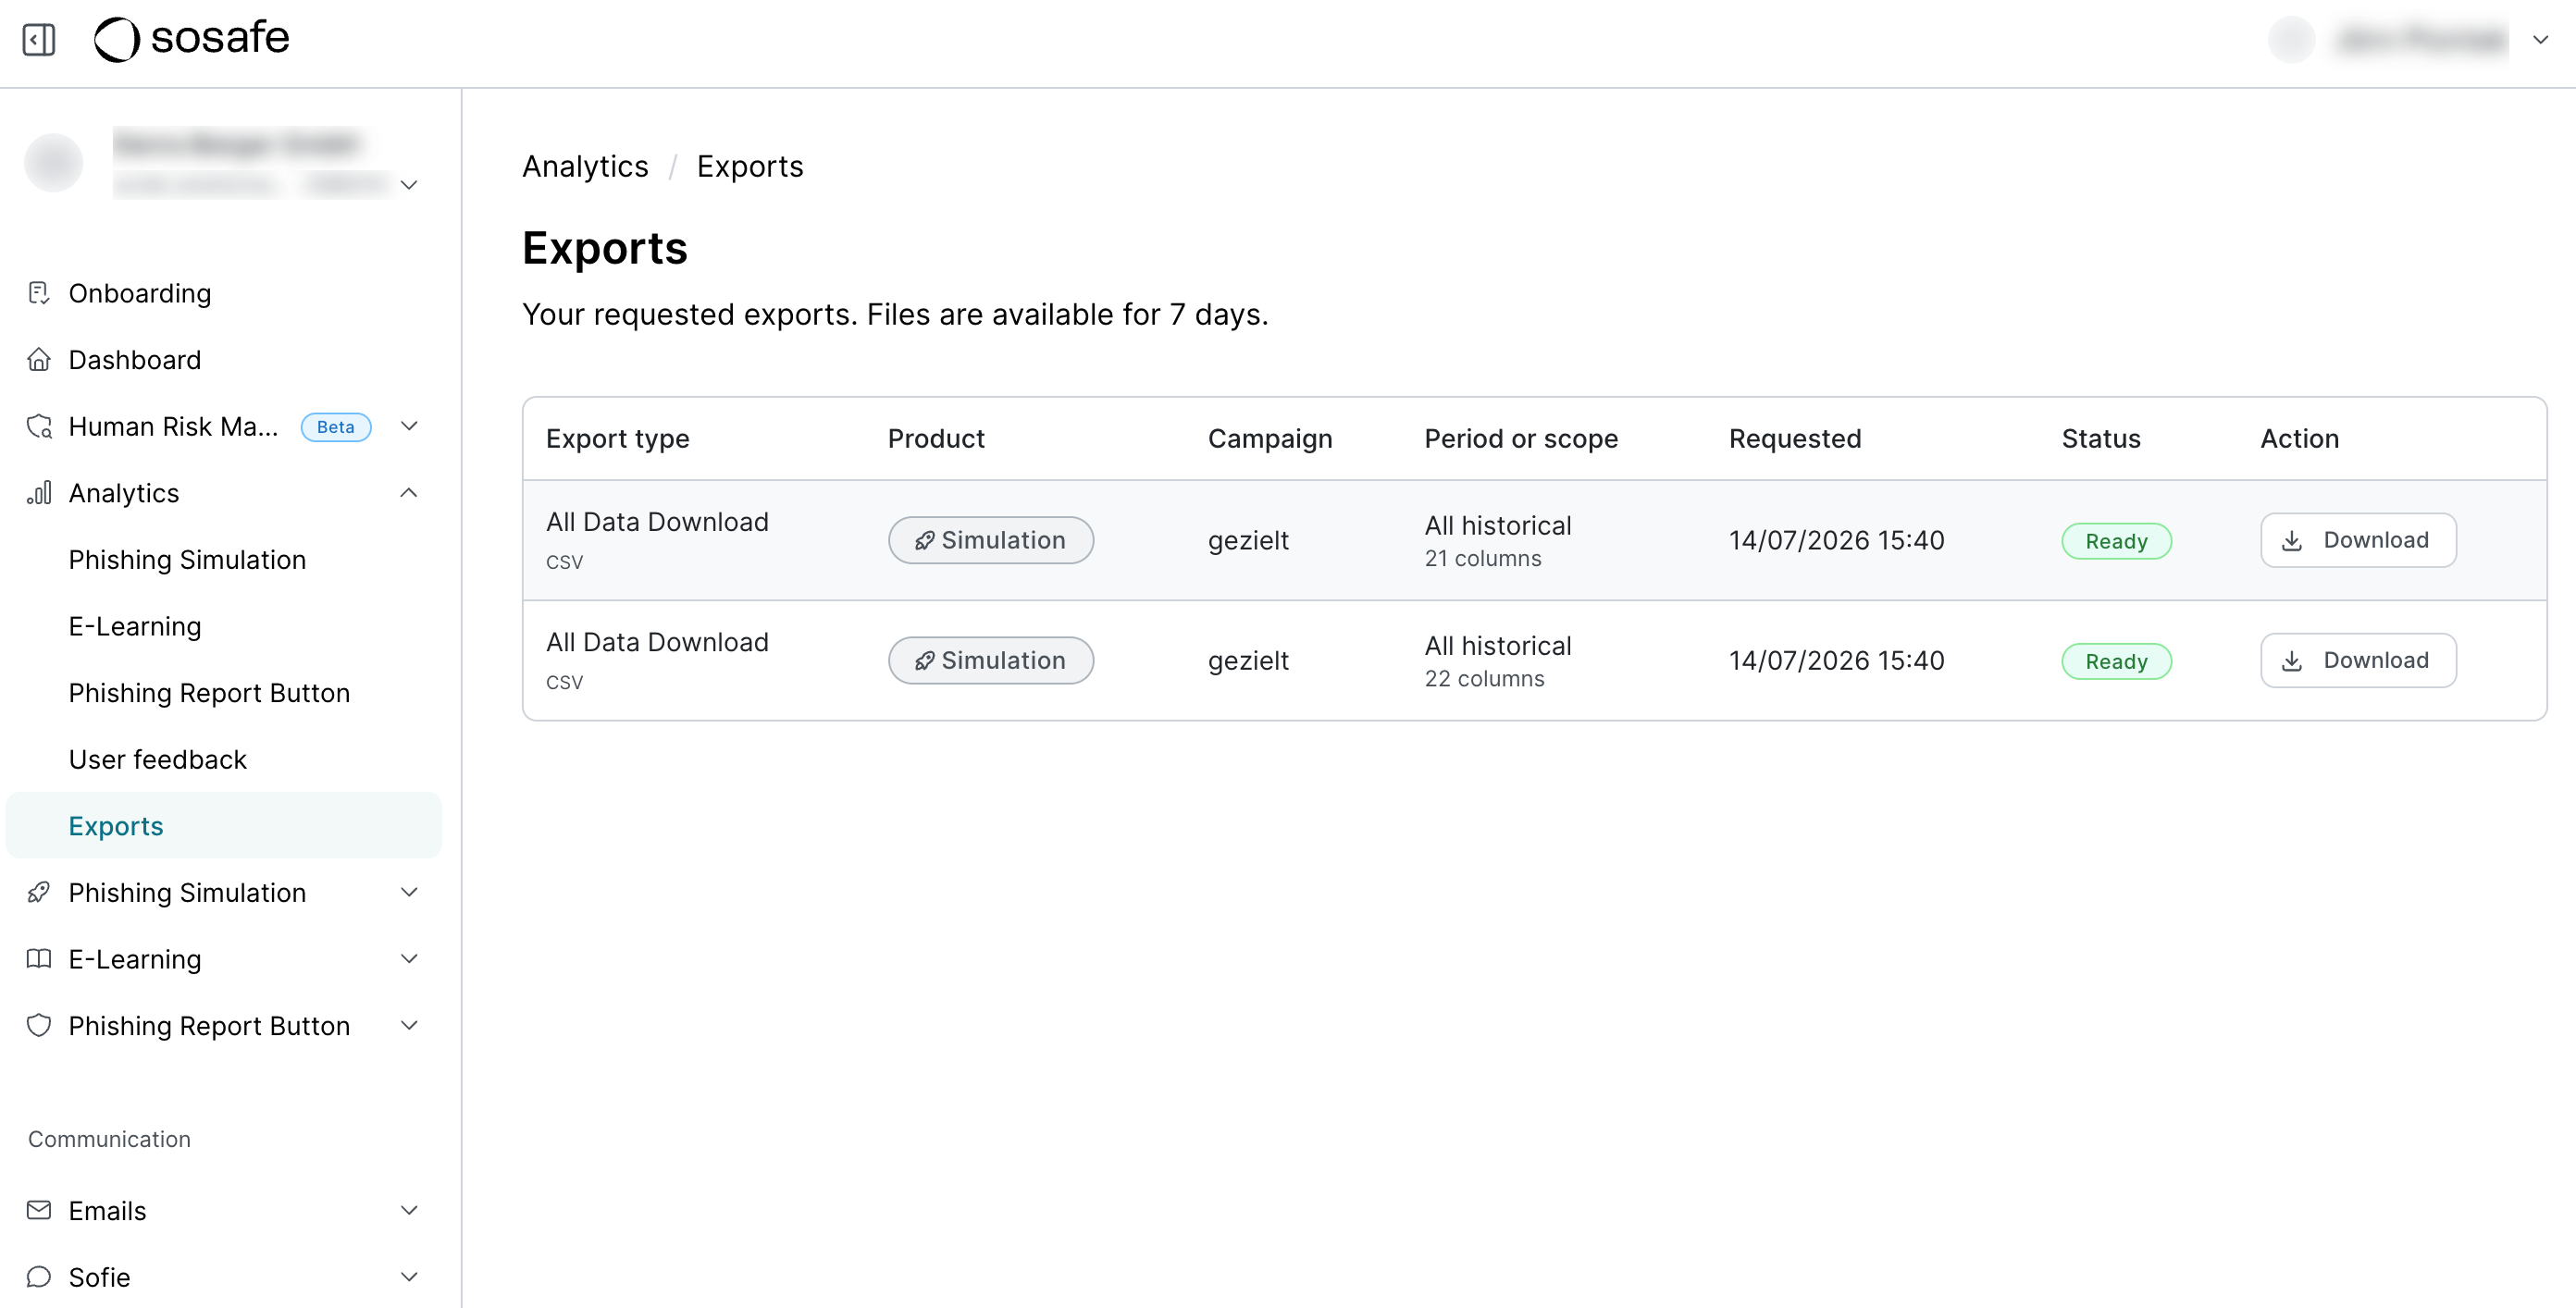
After you select Download data, you will be shown a preview of the data export. You can customize the columns that will be included in the export by selecting Edit Columns. Select Save once you’re happy with your selection and then Download CSV or Download XLSX. You will see a notification stating that your export is being prepared, which can take a few minutes. You will receive an email with a download link once it’s ready. In addition, all exports from your last 7 days are available to download by navigating to Analytics / Exports.
Archived campaigns
After the end of a campaign, its data gets archived. If you select such a campaign, the following banner will be shown.

Most data will continue to be available, both in the regular Analytics and in any exports. One thing to note is that the raw data export is based on live data, so information such as user groups might not reflect the state at the time of the campaign but rather the current state.
For instance, if a user was part of group A during a campaign but has since moved to group B, exports for the archived campaign will show them as a member of group B.