
These definitions apply to our Personalized Learning platform. For users of our classic e-learning platform, they might differ slightly.
Overview metrics
These metrics aim to give you the most important KPIs at a glance.
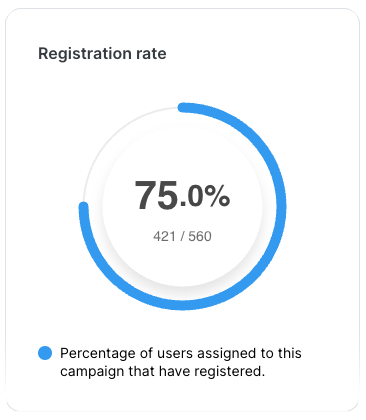
Registration rate
Definition
The registration rate shows percent of invited users to a campaign who have registered on the E-Learning platform.
Calculation
Registration count / Potential user count
Impact
Only registered users can actually participate in the e-learning. The higher the registration rate, the better.
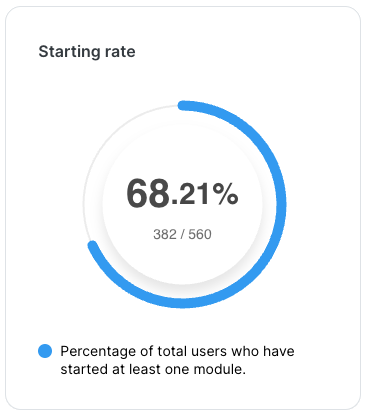
Starting rate
The starting rate shows percent of potential users in a campaign who have completed at least one module as defined in the base definitions.
Calculation
Started user count / Potential user count
Impact
Completing a lesson is the next step in terms of engagement after registering. The higher the starting rate, the better.
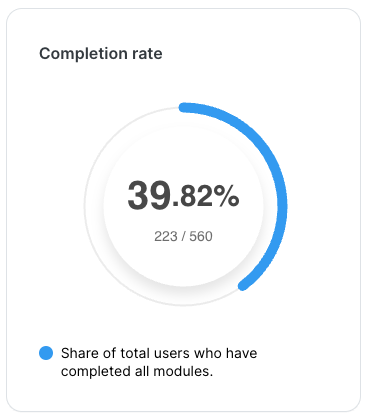
Completion rate
Definition
The completion rate shows percent of potential users in a campaign who have completed all modules as defined by in the base definitions. Note: At the top of the e-learning Analytics page, you can select whether all lessons should be taken into account, or whether you only want to consider either mandatory or optional lessons. When you’re using Personalized Learning, the completion rate will by default only factor in mandatory lessons.
Calculation
Completion count / Potential user count
Impact
This metric can vary substantially depending on how many lessons are included in your e-learning and how much time has passed. While a high completion rate is desirable, it is normal for it to take a while. Steady learning over time instead of forcing your users to complete the e-learning as quickly as possible leads to better outcomes.
Module Split Filter Behavior
Completion count follows the module split filter logic, and shows completion for the selected module set.
Multiple campaigns / Multiple tenants behavior
Classic Learning: For all overview metrics, the calculation for multiple campaigns and multiple tenants uses simple addition on each metric component. This means that if the same registered user is invited to multiple campaigns, they will be included in the registration count for each campaign being considered in the calculation.
Personalized learning: (multiple tenants only) For all overview metrics, the calculation for multiple tenants uses simple addition on each metric component.