
General information
To better analyze the errors you are experiencing, it is useful to look at the error messages in the browser console. You can view this by pressing the "F12" key on the keyboard in any browser. You may also have to click on the "Console" tab. Error messages shown in red are most pertinent.
These are the general instructions. Check the corresponding sections below for instructions on how to open the console in your specific browser.
-
Open the console window before the error occurs
-
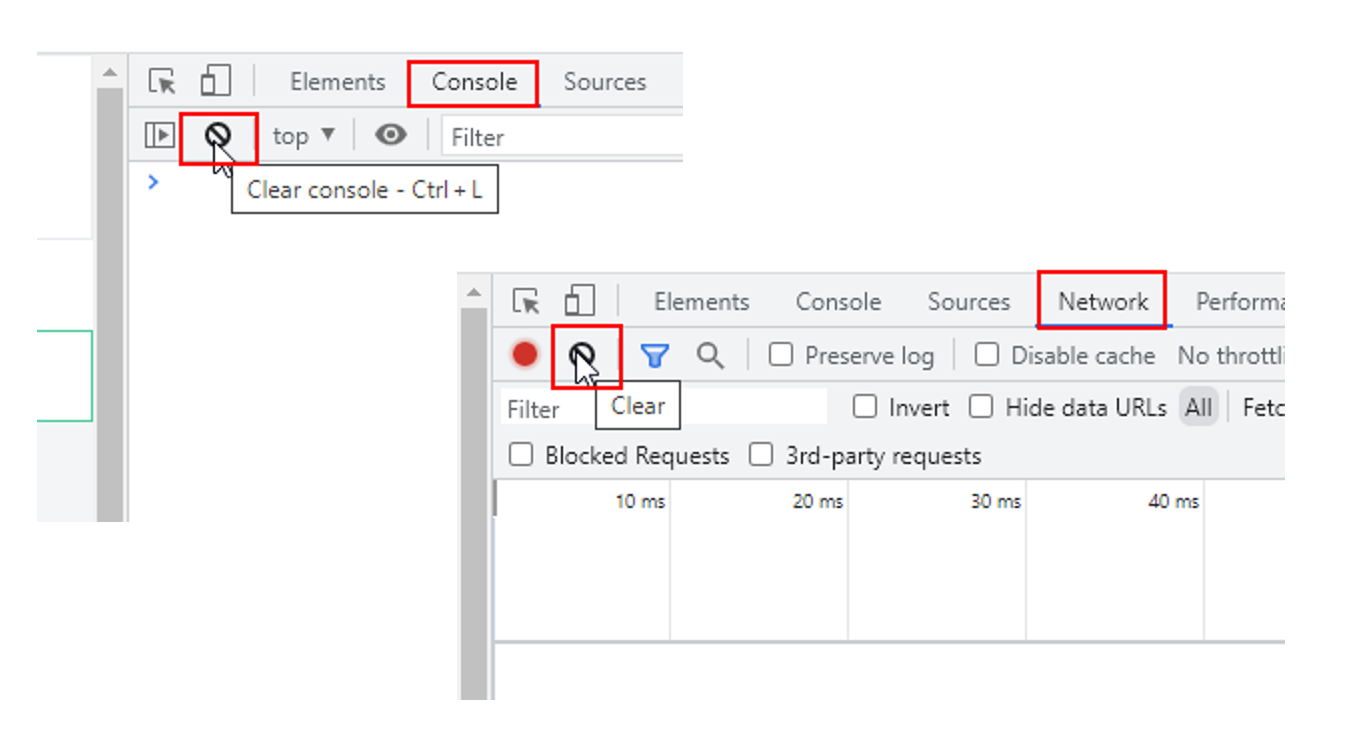
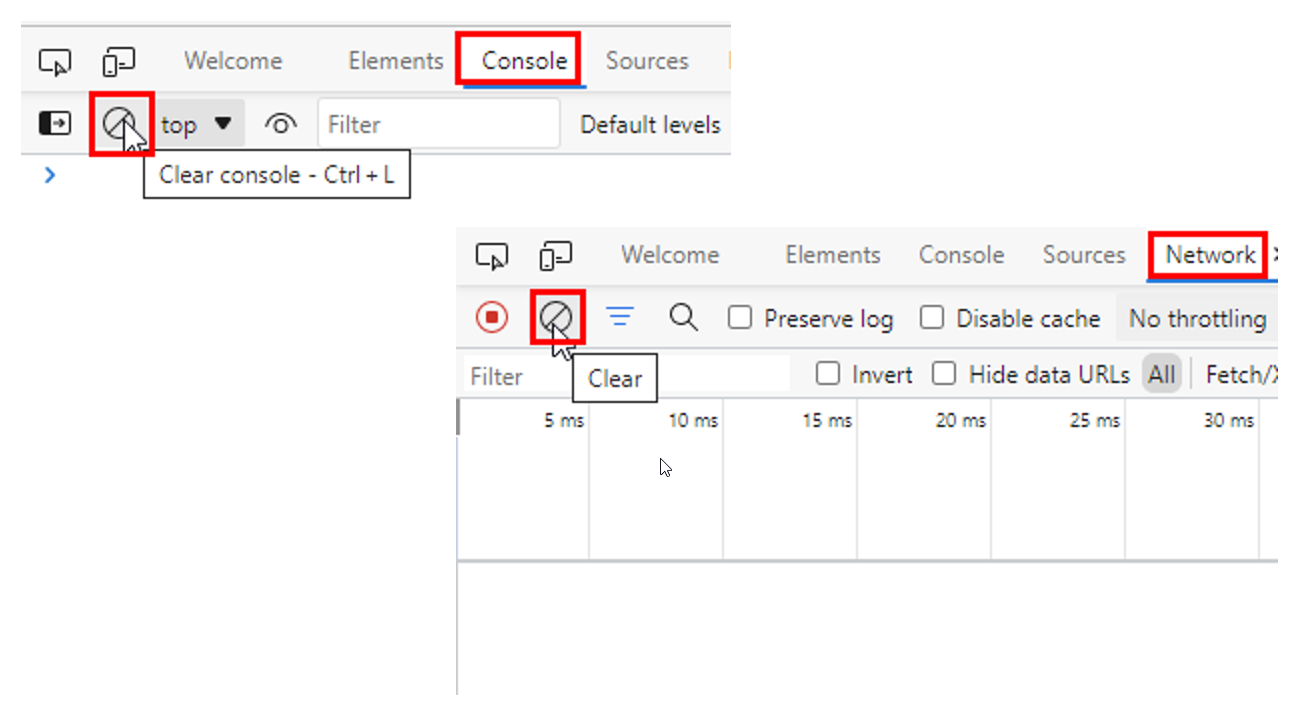
Select the console tab and clear all appearing entries via click on the button with the circle
-
Select the network tab and clear all appearing entries via click on the button with the circle
-
Now reproduce the error
-
Take a screenshot of the browser and console tab open and another one with the network tab open
-
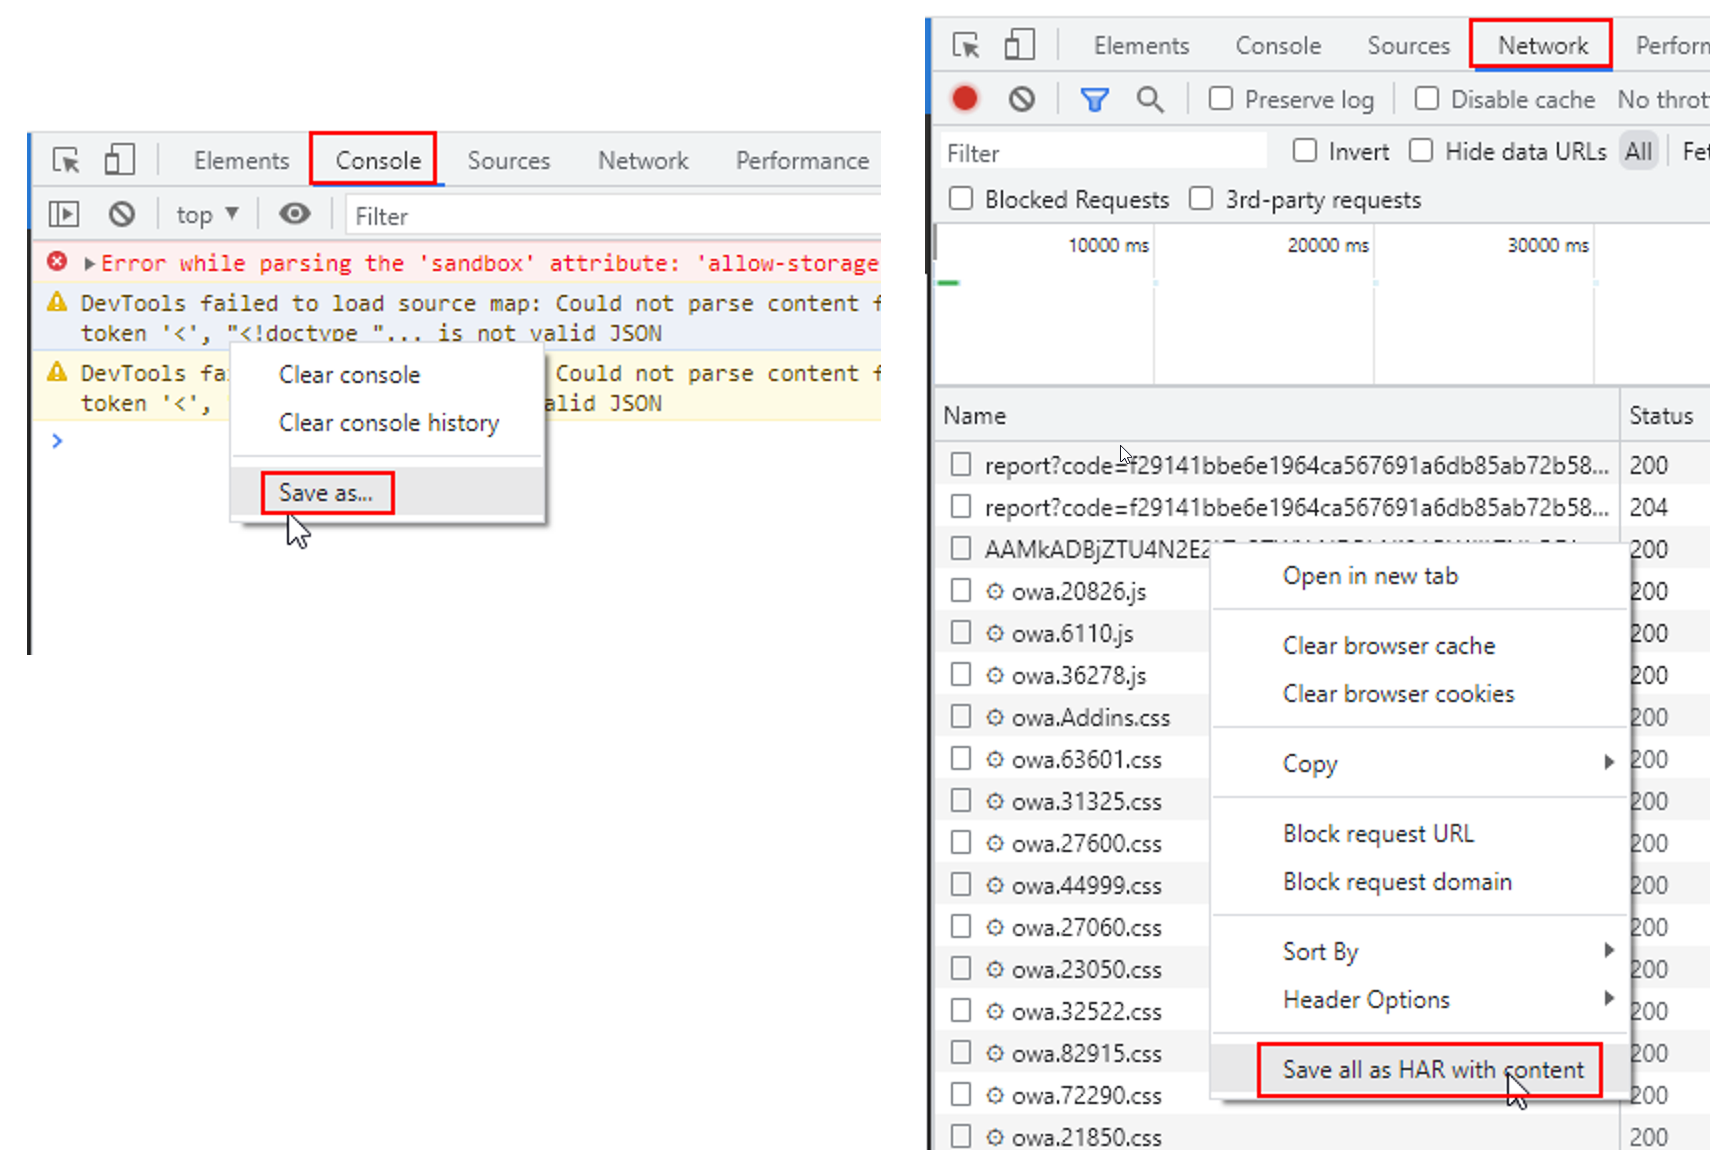
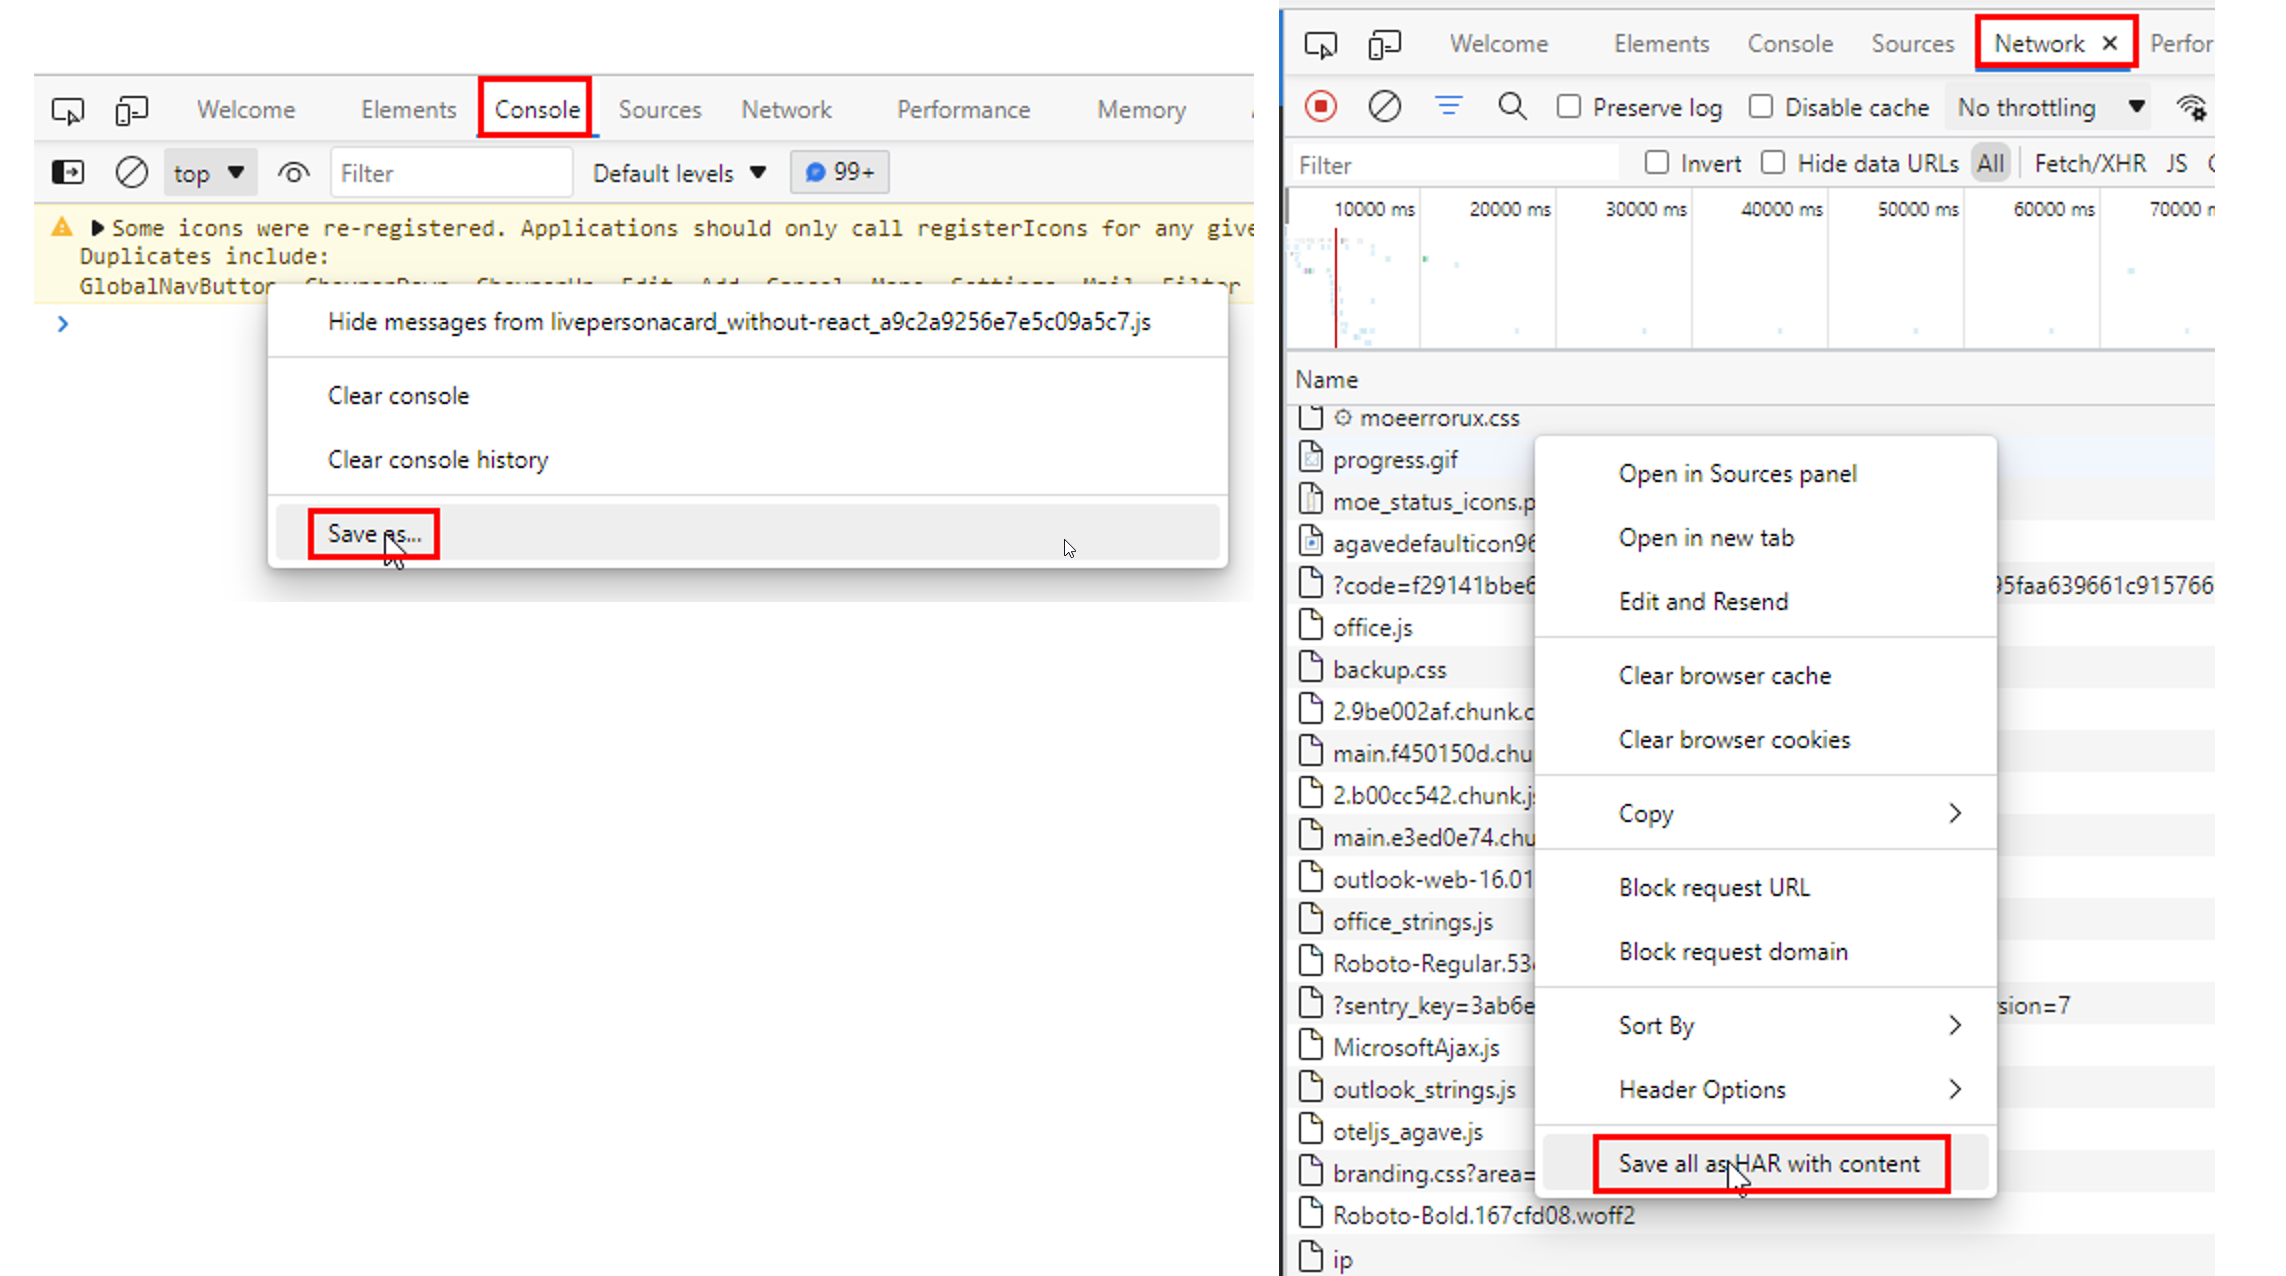
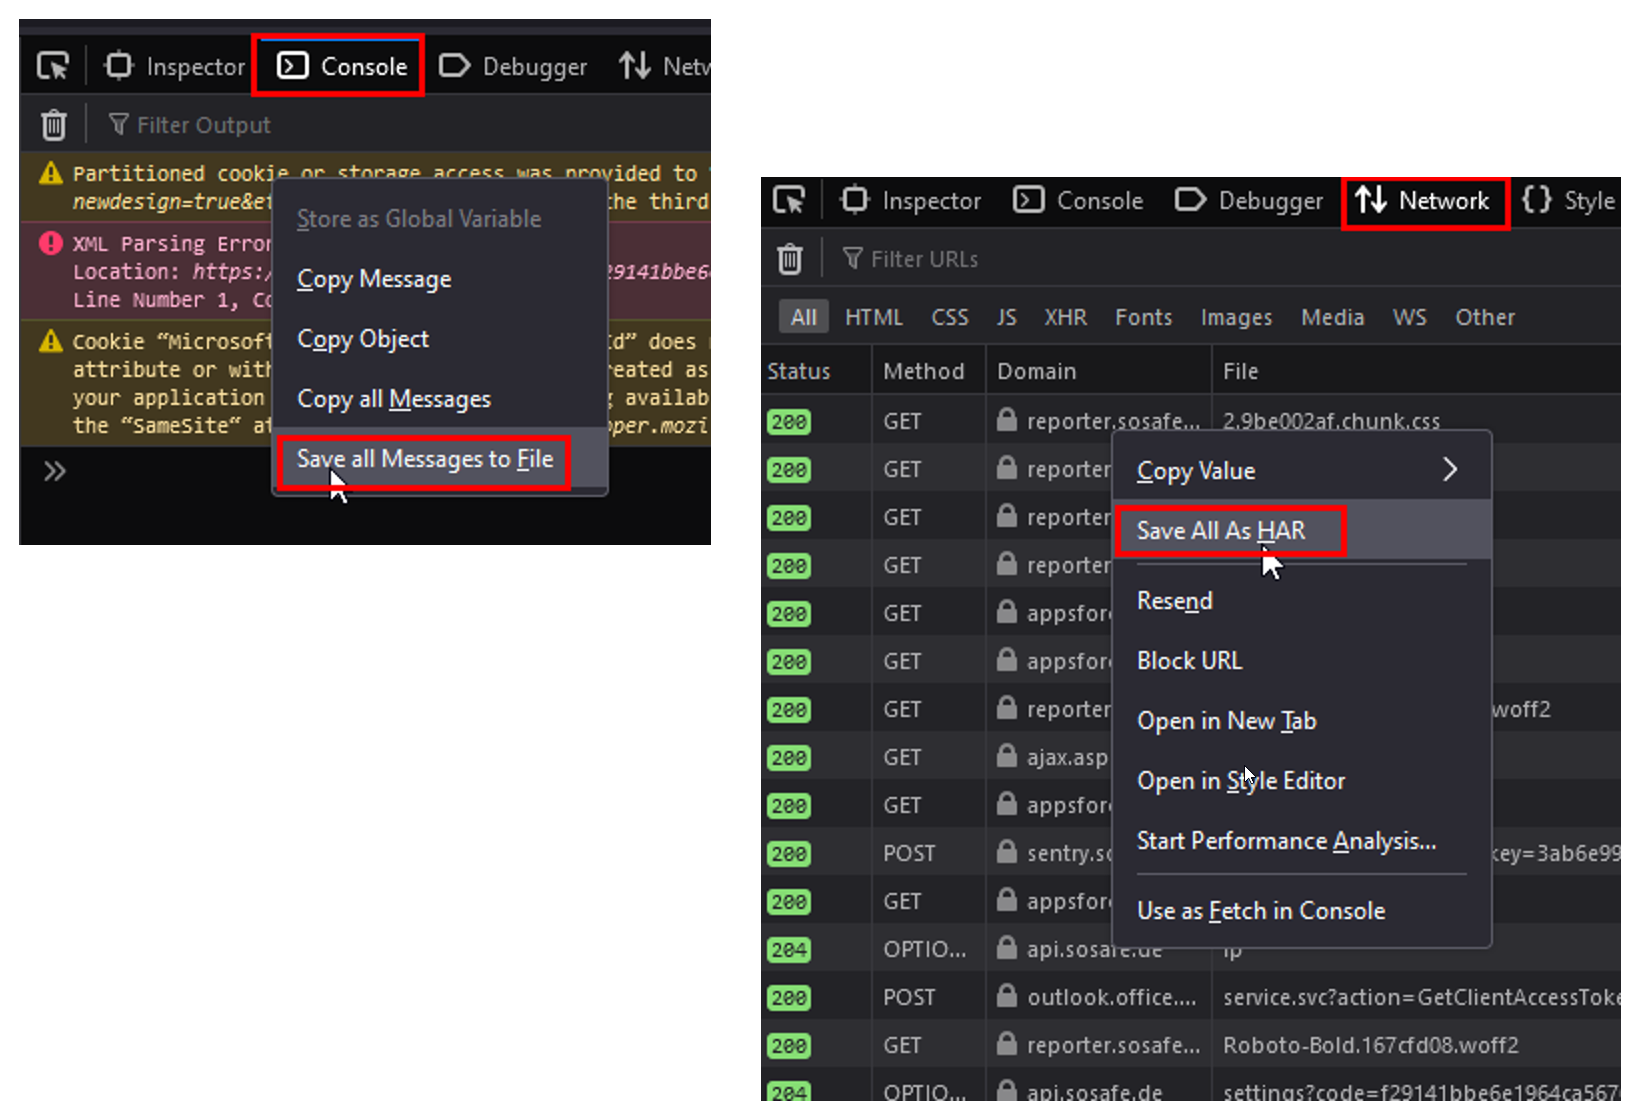
Finally save the content of the console tab by doing a right mouse click somewhere in the console window. Select "Save as..." in the appearing context menu. Repeat the same on the network tab and click on "Save all as HAR..." in the context menu
-
Send the screenshots and the two log files to SoSafe support
Chrome
After you opened the menu (Three dots) in the upper-right-hand corner of the browser window and select “More Tools” > “Developer Tools” or pressing F12, a column will open on the right. You may also have to click on “Console” or “Network“. Error messages are marked in red, warnings are in yellow.
Clear console + network tab:
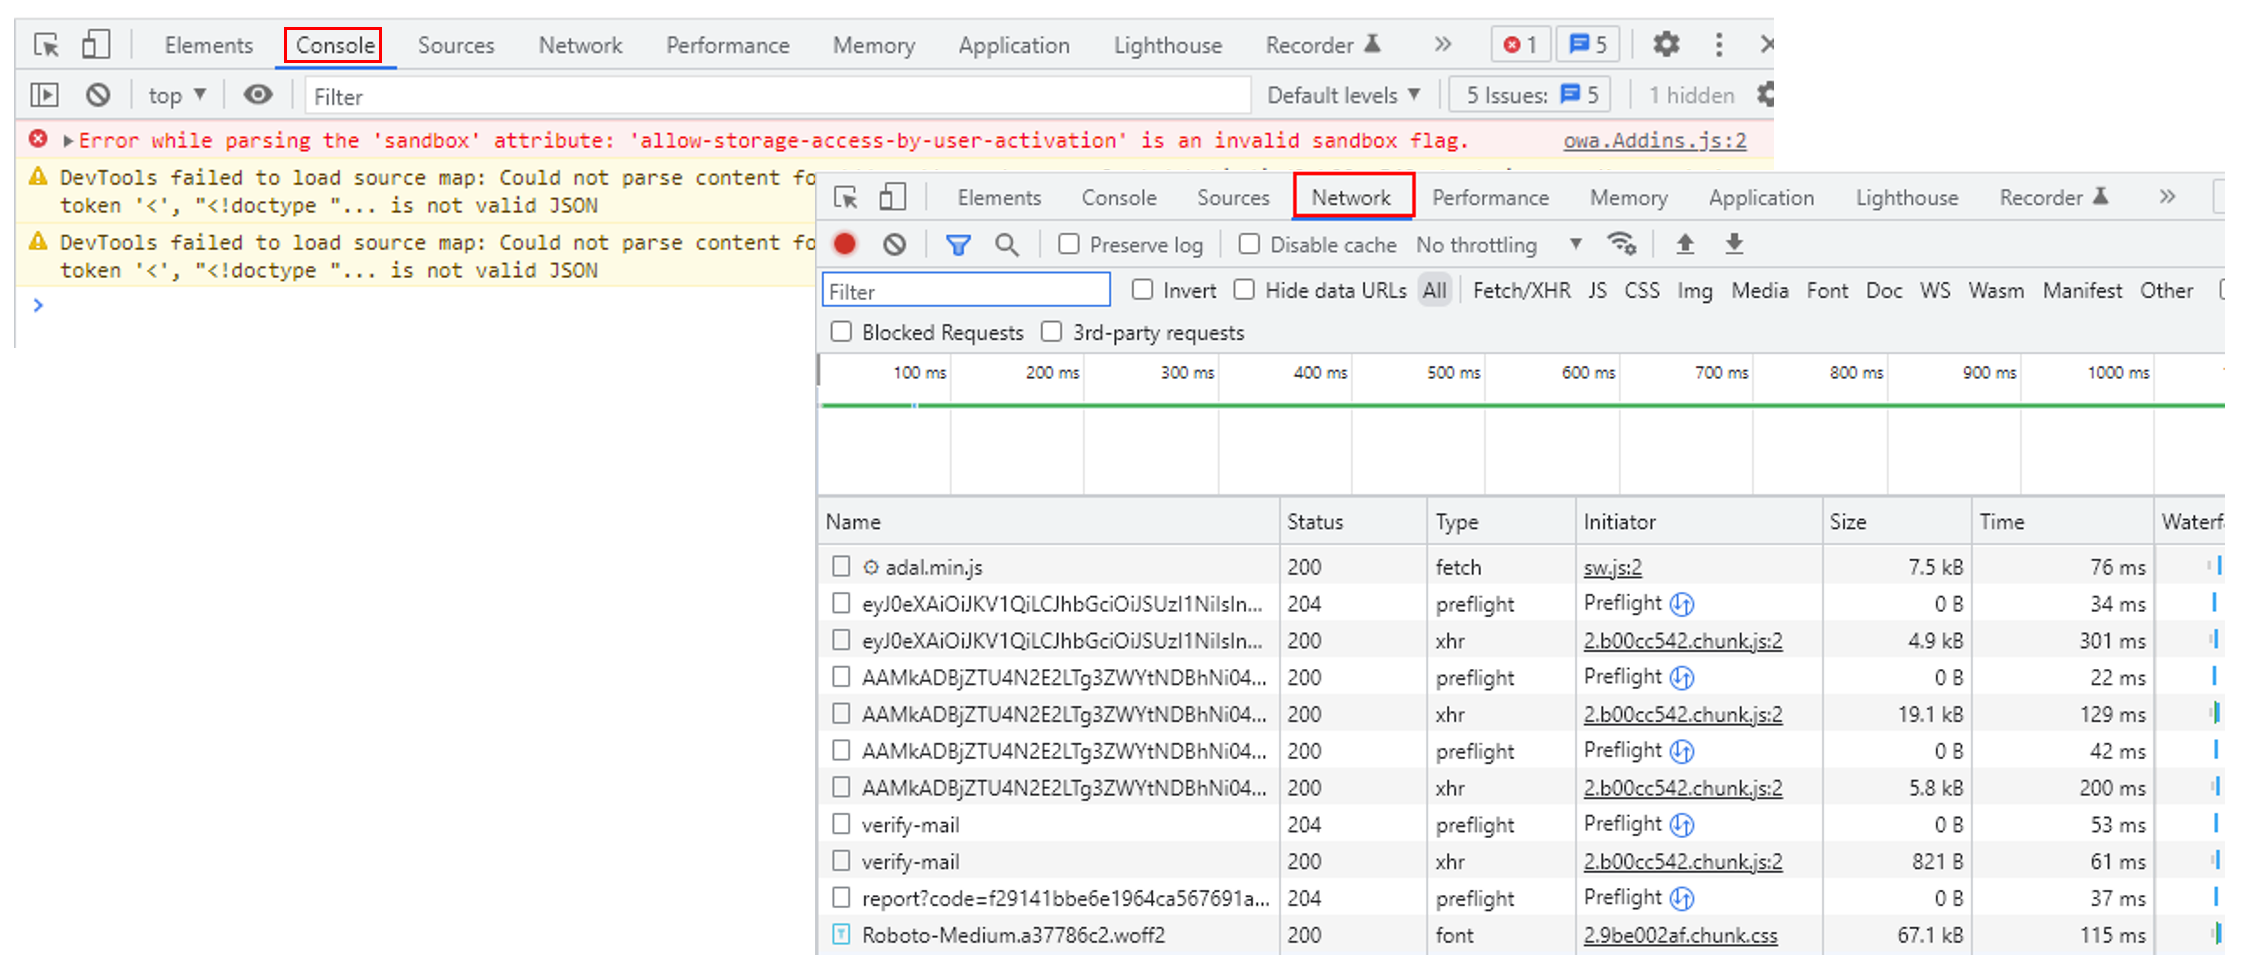
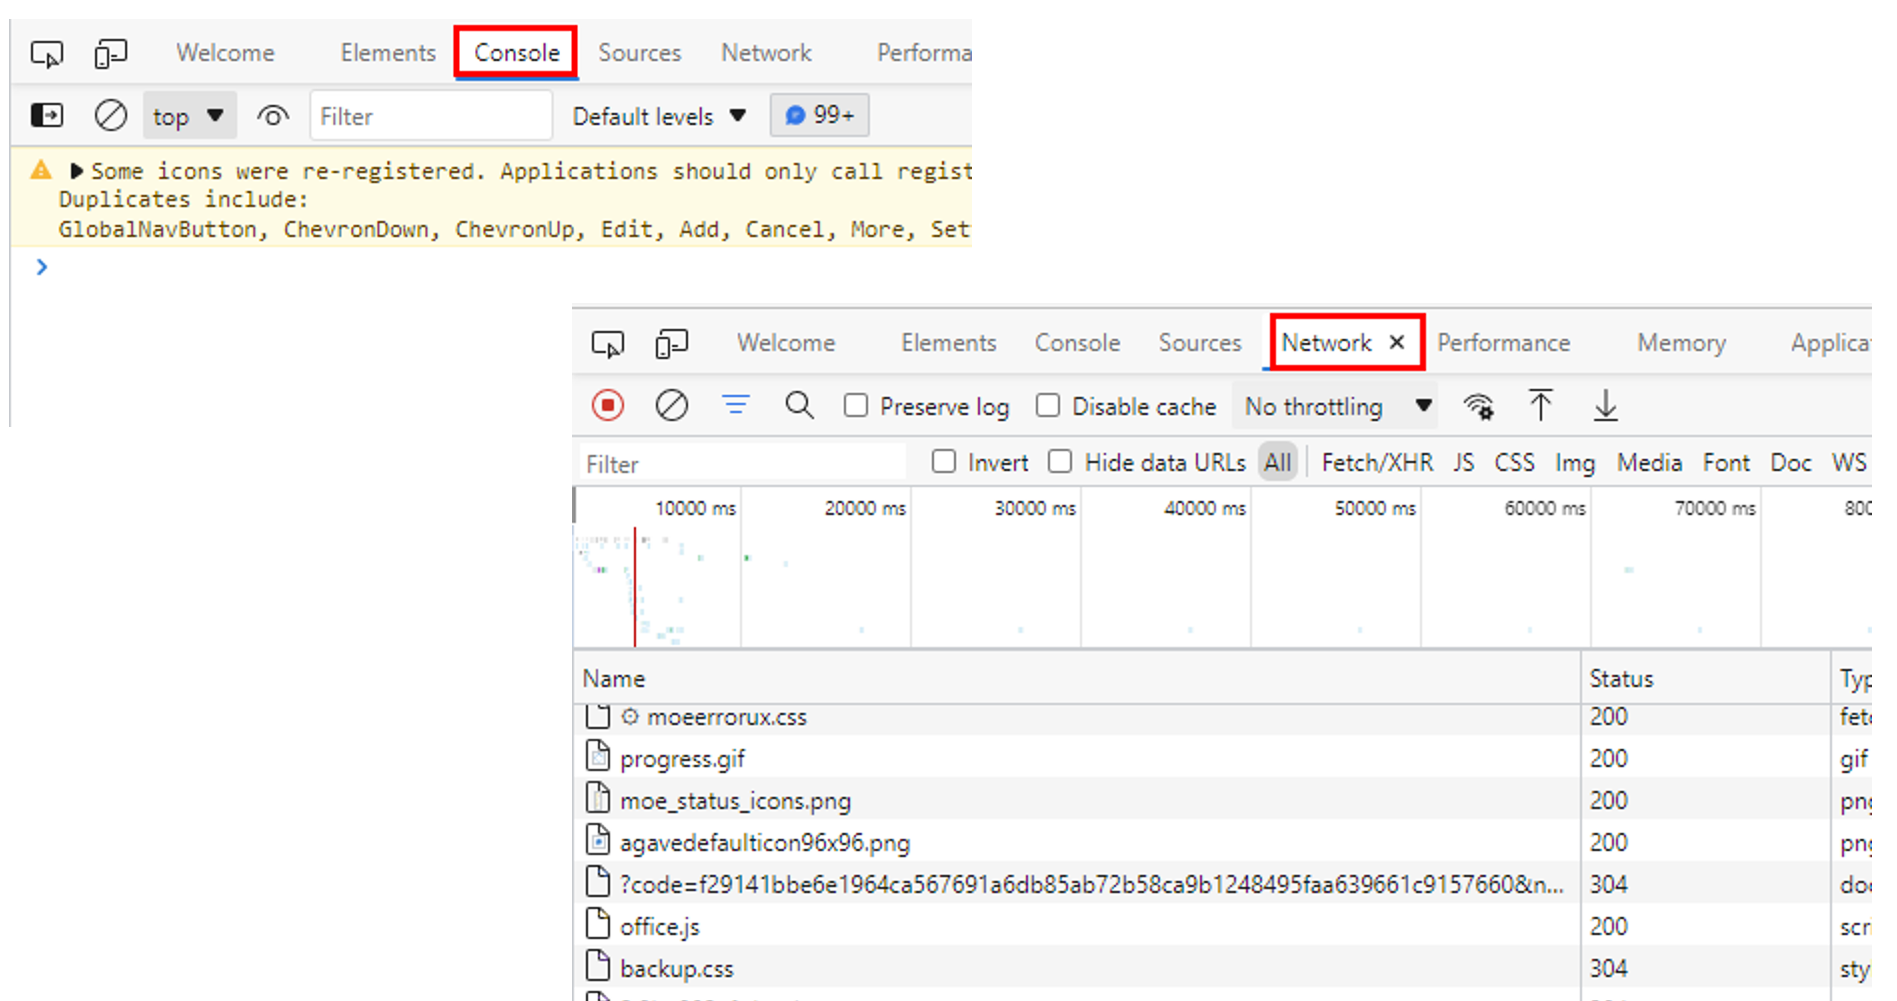
Console + network output:
Download console + network tab:
Edge
After you opened the menu (Three dots) in the upper-right-hand corner of the browser window and select “More Tools” > “Developer Tools” or pressing F12, a column will open on the right. You may also have to click on “Console” or “Network“. Error messages are marked in red, warnings are in yellow.
Clear console + network tab:
Console + network output:
Download console + network tab:
Firefox
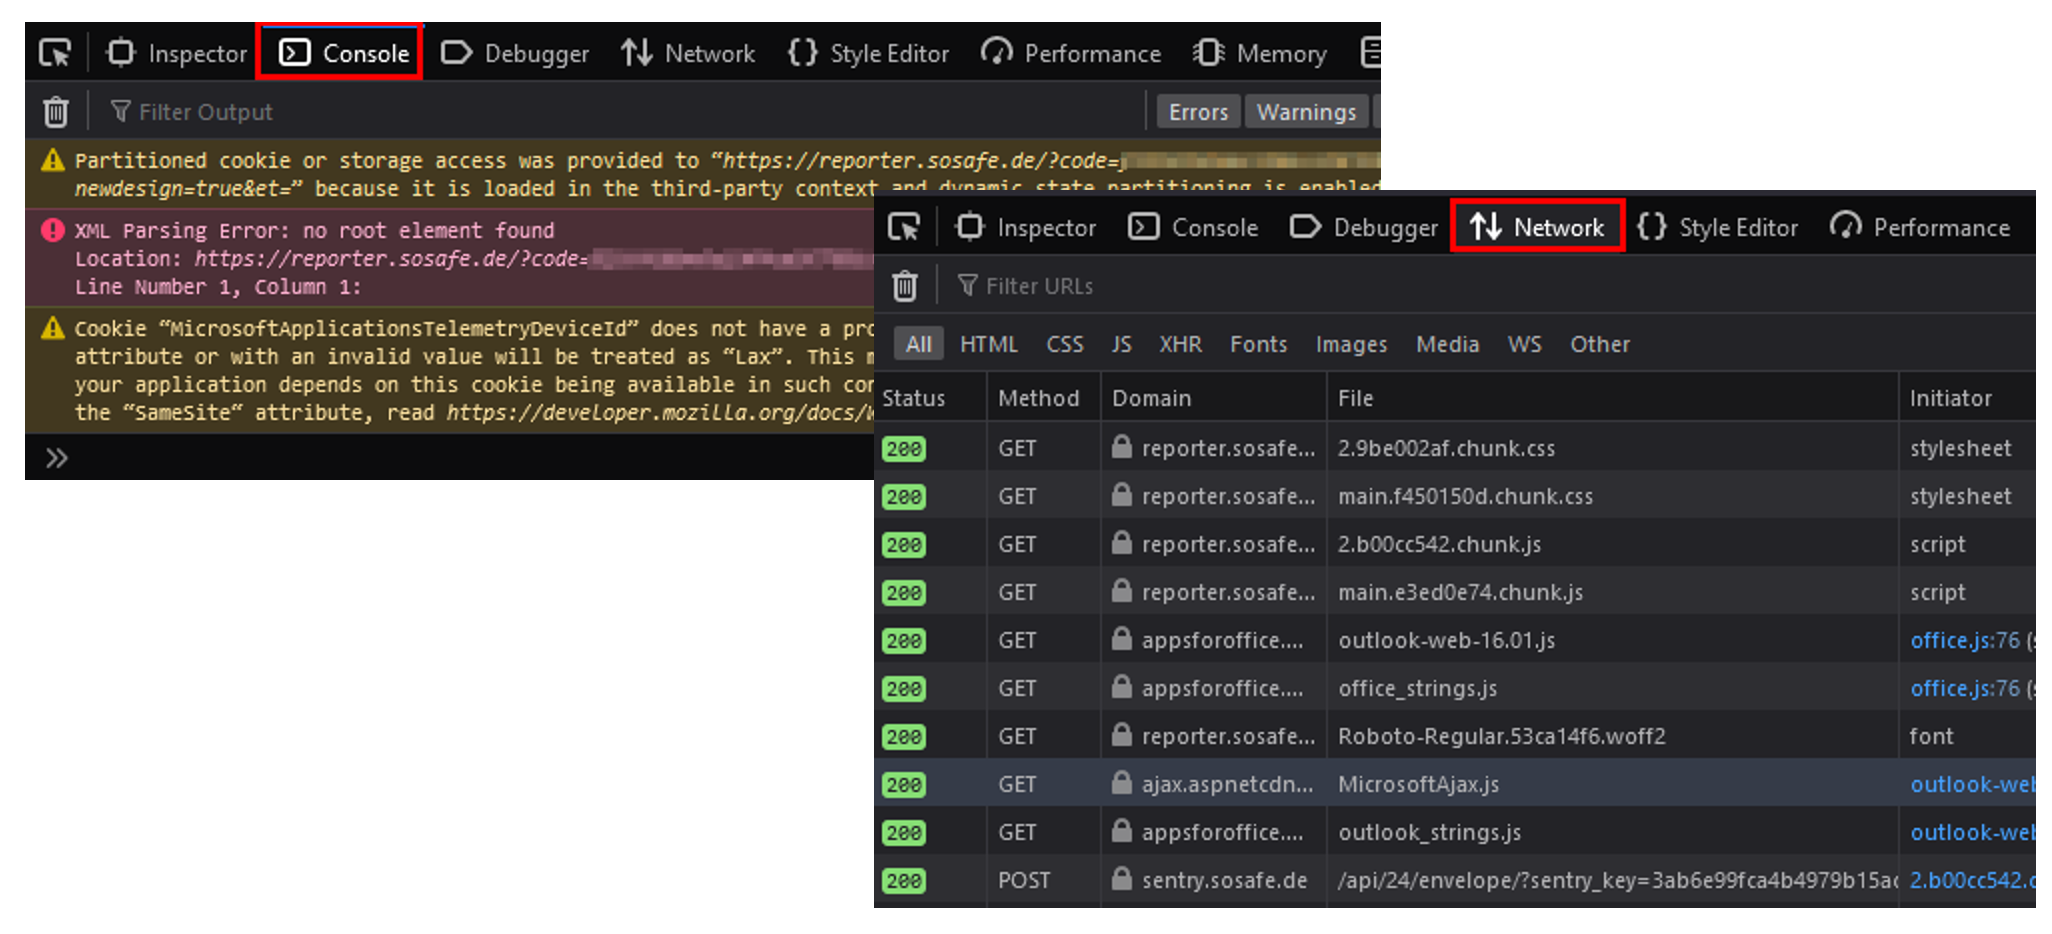
After you opened the menu (Three lines) in the upper-right-hand corner of the browser window and select “More Tools” > “Web Developer Tools” or pressing F12, a column opens at the bottom. You may also have to click on “Console” or “Network“. Error messages are marked in red, problems are in yellow. If the errors are not displayed all at once, the window can be enlarged by dragging the console margin (green arrow).
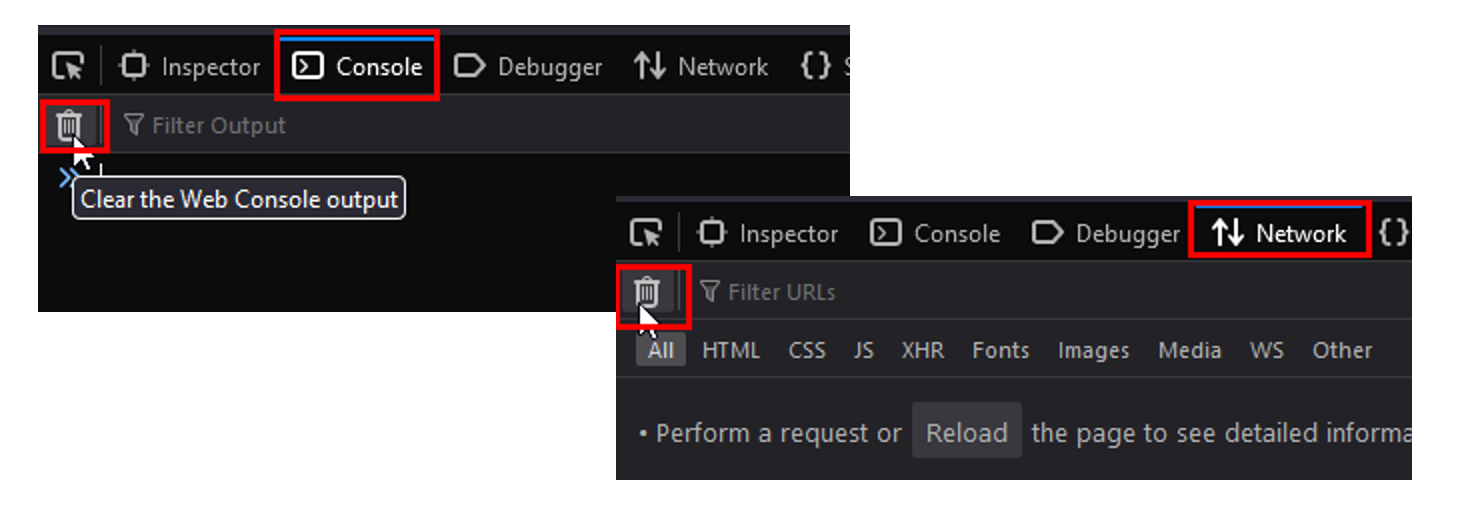
Clear console + network tab:
Console + network output:
Download console + network tab:
Internet Explorer
Note that Internet Explorer has been discontinued. We recommend using its successor Edge instead.
After pressing F12, a column opens at the bottom. You may also have to click on “Console”. Error messages are marked in red, warnings are in yellow. If the errors are not displayed all at once, the window can be enlarged by dragging the console margin.