
User rating
Definition
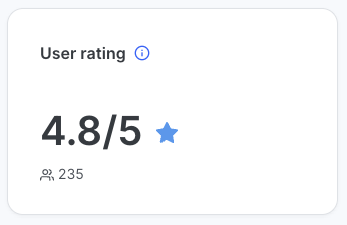
This shows the mean simulation user rating for all users in a tenant. Users can rate the Simulation platform experience out of five stars. The five star display rounds to the nearest star. The metric also displays the total count of ratings received.
Regardless of which campaigns are selected, this metric always shows all user ratings for the current tenant.
Impact
This gives a good indication of how happy your employees are with your simulation. Users sometimes react negatively to getting “caught” or if they feel like they are getting tested and evaluated. We recommend positive communication alongside a zero-blame culture.
Multiple tenants behavior
Individual Simulation user ratings from all included tenants are averaged.
User agent metrics
Definition
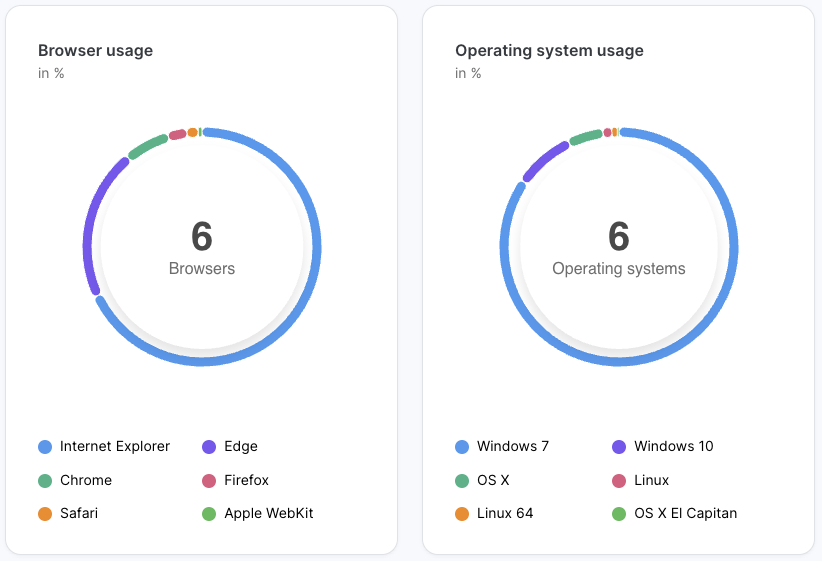
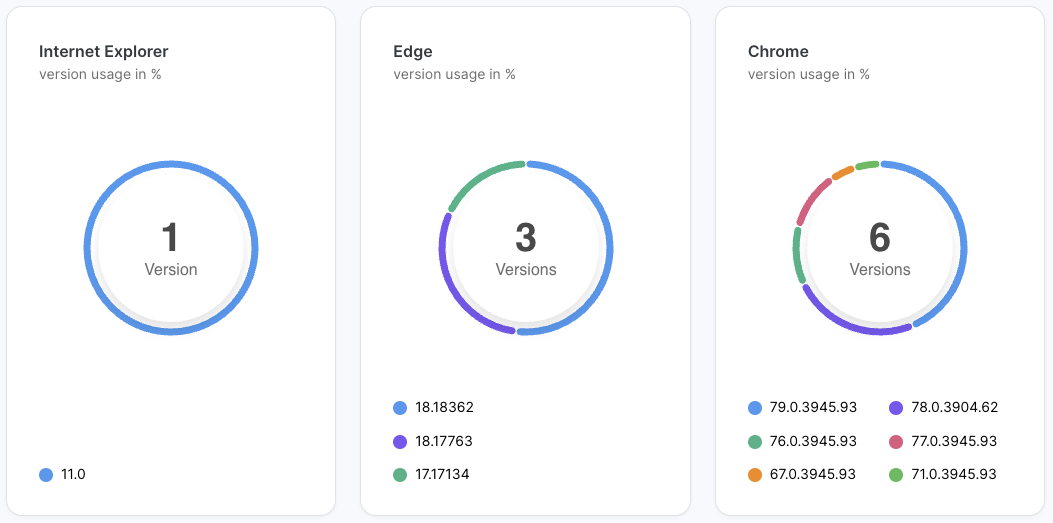
User agent metrics break down click counts in a campaign by data provided by the user’s browser. The pie charts show the overall percentage of the whole, but counts and specific percentages can be viewed via the tooltip by hovering on a pie chart category.
When six or fewer categories are present, all are shown. When more than six categories are present, only the five highest count categories are shown. Others are grouped as “Other” but the overall count is shown in the middle of the chart.
-
Click count broken down by browser
-
Click count broken down by operating system
-
Click count broken down by browser version within each browser. One card is shown for each browser, with up to three cards on each row
Impact
This information can be useful to find out whether outdated browser versions are still in use across your organization.
Multiple clients / Multiple tenants behavior
For all user agent metrics, the calculation for multiple clients and tenants combines events from all included campaigns. Total counts will therefore be the sum of all individual campaign accounts, and percentages will be calculated accordingly.
User overview table
The user overview table provides a set of user-specific metrics for each invited user in the campaign. The table is available if “Individual User Tracking” and “Individual User Data in Customer Report” are enabled, and it can only be viewed for a single campaign.
|
Column |
Description |
|---|---|
|
Name |
User’s first and last name |
|
|
User’s email |
|
User group |
User’s user group |
|
Emails sent |
Count of emails sent to the user |
|
Click rate |
User’s individual click count. Not rate as stated in the title. |
|
Open rate |
User’s individual open count. Not rate as stated in the title. |
|
Interaction rate |
User’s individual interaction count. Not rate as stated in the title. |
|
Learning rate |
User’s individual learning count. Not rate as stated in the title. |
|
Reply rate |
User’s individual reply count. Not rate as stated in the title. |
|
Reporting rate |
User’s individual reporting count. Not rate as stated in the title. |