Click rate
Definition
Percentage of successfully sent emails where the user clicked on an element in the email.
Calculation
Click count / Sent mails count
Impact
A high Base Click Rate suggests that employees are still prone to phishing attempts, indicating a need for further training. A decreasing trend in this metric demonstrates improved awareness and reduced risk exposure.
.png?cb=509fb6ca764eaa35e2950b4309241763)
Interaction rate
Definition
Certain simulated phishing emails direct the user to a landing page (such as a fake login page) when the user clicks on a link. The interaction rate takes the number of visits to these landing pages as a baseline and shows the percentage of users who tried to interact with it (for instance by trying to enter account data).
Calculation
Interaction count / Landing page visit count
Impact
This metric measures how often users engage with phishing landing pages after clicking a simulated phishing email. A high rate may indicate curiosity or a lack of awareness. A declining rate suggests increasing skepticism and awareness.
.png?cb=521ca7e630f322a481f6f2f482079014)
Reply rate
Definition
Percentage of emails successfully sent where the user replied to the email. Automated replies are not counted.
Calculation
Reply count / Sent mails count
Impact
Replying to phishing emails is a significant risk factor, as it indicates susceptibility to social engineering attacks. A high Base Reply Rate highlights potential vulnerabilities and the need for targeted security awareness training on phishing mail threats.
.png?cb=a603d3c43e4cfaefd8dcc42fee92d4b7)
Reporting rate
Definition
Percentage of emails successfully sent where the user reported the email using the Phishing Report Button.
Reported external emails
The number of emails reported via the Phishing Report Button that were not part of a SoSafe simulation campaign.
Calculation
Reported count / Sent mails count
Impact
A higher Base Reporting Rate indicates strong employee awareness and proactive threat identification. An increase in this metric suggests that users are effectively recognizing and reporting phishing attempts, contributing to overall organizational security.
.png?cb=67b5c846e61752d1872f6b212b05ec21)
Open rate
Definition
Percentage successfully sent emails where the user downloaded the tracking pixel in the email.
Calculation
Open count / Sent mails count
Impact
A high Base Open Rate suggests that employees are opening phishing emails, potentially increasing the risk of compromise. Monitoring this metric helps determine if users are becoming more cautious about unsolicited emails over time.
.png?cb=9a22ffee2aa1c3d4bc5d832fb151d37f)
Share of emails sent
Definition
The percentage of all emails planned in the campaign that have actually been sent.
Error rate
The percentage and number of sent emails that were rejected by the mail server.
Calculation
Emails sent / Emails planned in campaign
Impact
Think of this as your campaign progress. If this value is at 0%, no simulated phishing mails have been sent as part of your selected campaign. The error rate is helpful to determine if there might be an issue with your Whitelisting settings or other technical issues.
.png?cb=55d4cb646650f5fbaf968dff7885d253)
Mobile click rate
Definition
Percentage of emails clicked where the user was on a mobile device.
Calculation
Mobile count / Click count
Impact
This metric helps assess how often users interact with phishing emails on mobile devices, which may pose additional risks due to limited security controls (e.g., lack of email previews or URL visibility). A high rate suggests that security training should emphasize mobile-based phishing risks.
.png?cb=0cd60068684e0131c02638cc6d64f426)
Learning rate
Definition
Certain simulated phishing emails direct the user to learn more about phishing when the user clicks on a link. This metric marks the percent of these emails where a user visited the learning page and clicked at least two explanatory texts, compared to the overall number of this type of email that was sent and clicked.
Calculation
Learning count / Learning page visit count
Impact
A higher Base Learning Rate indicates that users who engage with phishing emails are taking the opportunity to educate themselves and engaging with the learning content, leading to improved long-term awareness. A low rate suggests a need to optimize training visibility and engagement strategies.
.png?cb=a24ab18b3f2234de6bb6f7712cbeb659)
User group comparison
This chart provides an overview of the metrics above broken down by your user groups. You can use the filter at the top to only look at specific user groups and also change the sorting by selecting a column.
Impact
This chart helps you figure out which departments need to improve in which area. Use this information to address specific weaknesses in your security culture.
.png?cb=f25a13f74b5c0ab85e910c76861806c3)
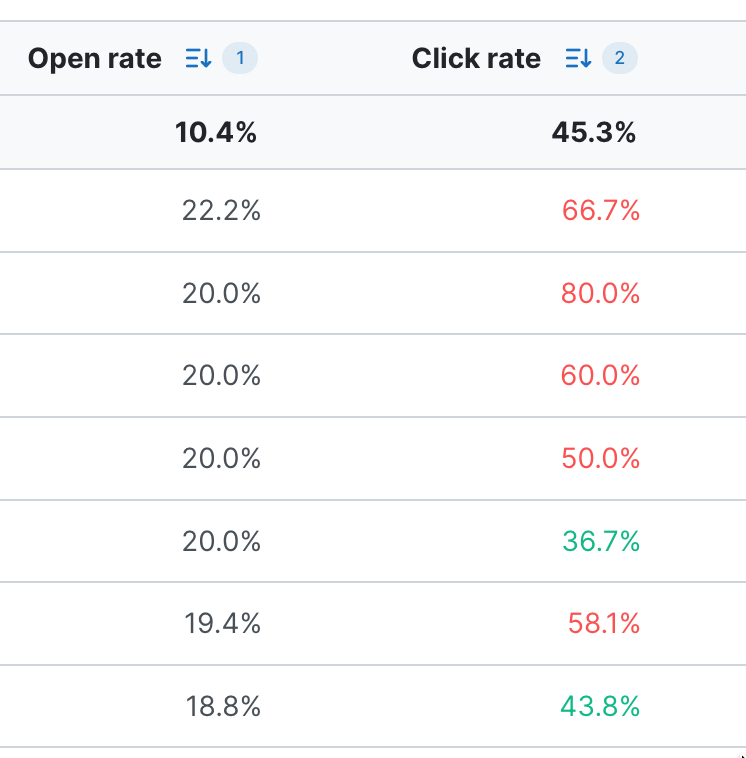
Multi-column sorting
In both the user group comparison and the template performance table, you can use multiple columns to achieve complex sorting. As an example, if you first select Open rate and then Click rate, you will get a table orders groups by their open rate first and if the open rate is the same for several groups, it will then sort these groups by their click rate. The order is indicated by a small number in the header row for that column.
If you click on a column a second time, it will change sorting from descending to ascending. Clicking it a third time removes the column from the current sorting. If all columns are deactivated, the table will default back to alphabetical sorting based on the user group name.