
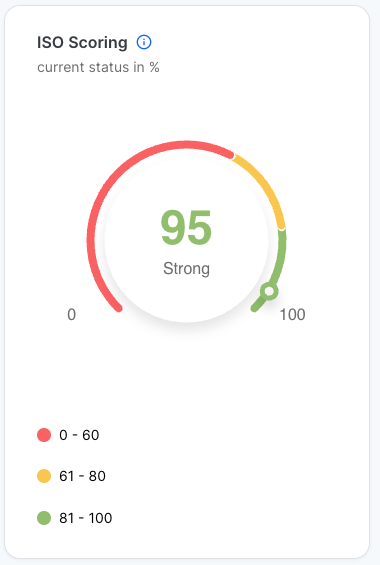
ISO scoring gives a standard way for companies to show their progress for certification. Progress is tallied at the end of each month, and a progressing score is also shown for the current month.
ISO Scoring
This represents the most recent month’s ISO score. See Proof of Implementation for information about how it’s calculated.
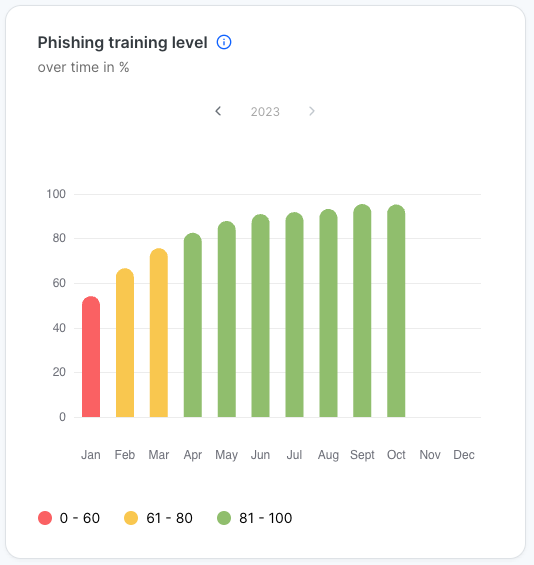
Phishing training level
This chart shows past monthly ISO scores. The scores are cumulative and are based on the click rate, interaction rate and reply rate as of the end of the given month.
Proof of Implementation
This chart provides all technical details for how the ISO scoring and phishing training level are calculated.
|
Column |
Description |
|---|---|
|
Month |
Year and month for the calculation. All calculations are cumulative. The date range runs from the start your product usage until the end of the last day of the indicated month. |
|
Sent |
Cumulative sent count as of the end of the month. |
|
Clicks |
Cumulative click count as of the end of the month. |
|
Reports |
Cumulative report count as of the end of the month. |
|
Interactions |
Cumulative interaction count as of the end of the month. |
|
a |
Clicks / Sent |
|
b |
1 - (Reports / Sent) |
|
c |
Interactions / Sent Note that this is NOT the interaction rate. The interaction rate denominator is the number of emails clicked where a click results in a user being sent to a landing page. |
|
d (Phishing Training Level) |
1 - ( 0.4 * a + 0.2 * b + 0.4 * c ) |
|
Scoring |
A colored dot representing the health of the score for that month Red - (0 - 60) Poor Yellow - (60 - 80) Fair Green - (80 -100) Good |