
Passed modules by user group
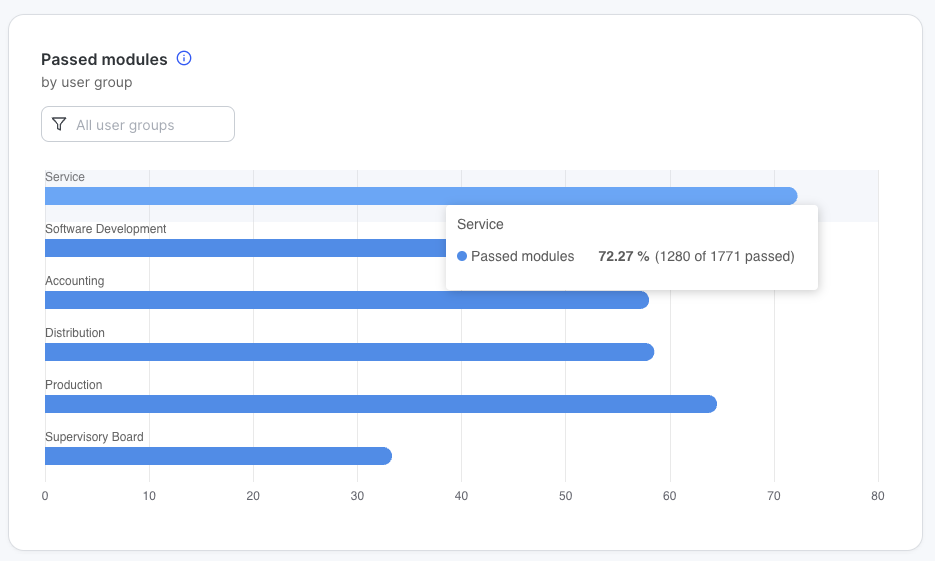
Definition
This shows the percentage of all completed modules in a user group compared to the sum count of all modules assigned to users in that user group.
Module names are only available for languages where at least one user in the campaign has completed a module in that language. This chart will first attempt to show modules in the language set for the current Manager user. If not available, the chart will show the names in English.
Multiple campaigns / Multiple tenants behavior
Classic Learning: Users are assigned modules per campaign, so for multiple campaigns, assignments within a single user group are simply added together.
Since user groups exist within a single tenant, multiple tenants will simply show the union of all user group completion rates in each tenant.
Personalized Learning: (multiple tenants only) Since user groups exist within a single tenant, multiple tenants will simply show the union of all user group completion rates in each tenant.
Module split filter behavior
Only individual completion instances according to the filter setting are included in the average.
Impact
This metric provides a good overview of the learning progress across user groups. Useful for identifying user groups that are outperforming the average in your company or ones that do worse.
Completion rate by module
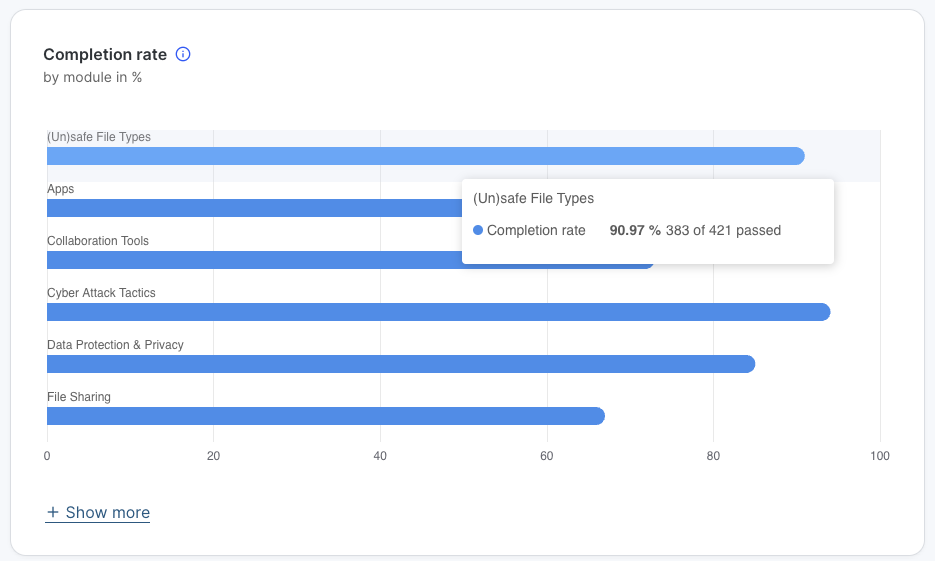
Definition
This shows the percentage of users who have completed a module compared to the total number of users to whom the module was assigned, broken down by module.
Note: Module names are only available for languages where at least one user in the campaign has completed a module in that language. This chart will first attempt to show modules in the language set for the current Manager user. If not available, the chart will show the names in English.
Multiple campaigns / Multiple tenants behavior
Classic Learning: Users are assigned modules per campaign, so module assignments and completions across all included campaigns and tenants are simply added together.
Personalized Learning: (multiple tenants only) Total number of user completion instances is compared to the total number of module assignments for each module.
Module split filter behavior
Only individual completion instances according to the filter setting are included in the average.
Impact
This metric can help identify unpopular modules. You might want to stress their relevance in your internal communication - or consider removing them if they are not relevant.