
Read this article in: Deutsch
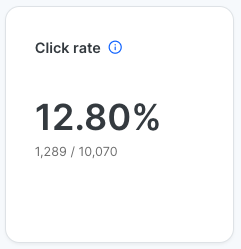
Click rate
Definition
Percent of emails successfully sent where the user clicked on an element in the email.
Calculation
Click count / Sent mails count
Impact
A high Base Click Rate suggests that employees are still prone to phishing attempts, indicating a need for further training. A decreasing trend in this metric demonstrates improved awareness and reduced risk exposure.
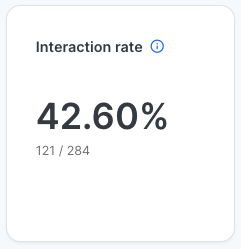
Interaction rate
Definition
Certain simulated phishing emails direct the user to a landing page when the user clicks on a link. This metric marks the percent of these emails where a user interacted with the landing page compared to the overall number of this type of email that was sent and clicked.
Calculation
Interaction count / Landing page visit count
Impact
This metric measures how often users engage with phishing landing pages after clicking a simulated phishing email. A high rate may indicate curiosity or a lack of awareness, while a declining rate suggests increasing skepticism and awareness.
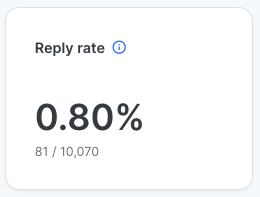
Reply rate
Definition
Percentage of emails successfully sent where the user replied to the email.
Calculation
Reply count / Sent mails count
Impact
Replying to phishing emails is a significant risk factor, as it indicates susceptibility to social engineering attacks. A high Base Reply Rate highlights potential vulnerabilities and the need for targeted security awareness training on phishing mail threats.
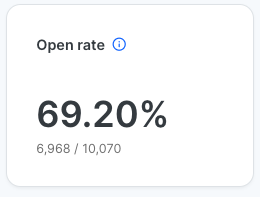
Open rate
Definition
Percent of emails successfully sent where the user downloaded the tracking pixel in the email.
Calculation
Open count / Sent mails count
Impact
A high Base Open Rate suggests that employees are opening phishing emails, potentially increasing the risk of compromise. Monitoring this metric helps determine if users are becoming more cautious about unsolicited emails over time.
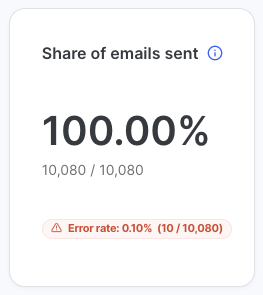
Share of emails sent
Definition
The percentage of all emails planned in the campaign that have actually been sent
Error rate
The percentage and number of sent emails that were rejected by the mail server.
Calculation
Emails sent / Emails planned in campaign
Impact
Think of this as your campaign progress. If you’re at 0%, no simulated phishing mails have been sent as part of your selected campaign. The error rate is helpful to determine if there might be an issue with your Whitelisting settings or other technical issues.
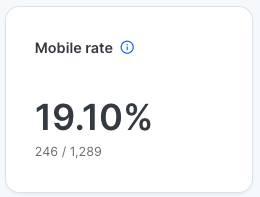
Mobile rate
Definition
Percentage of emails clicked where the user was on a mobile device.
Calculation
Mobile count / Click count
Impact
This metric helps assess how often users interact with phishing emails on mobile devices, which may pose additional risks due to limited security controls (e.g., lack of email previews or URL visibility). A high rate suggests that security training should emphasize mobile-based phishing risks.
Learning rate
Definition
Certain simulated phishing emails direct the user to learn more about phishing when the user clicks on a link. This metric marks the percent of these emails where a user visited the learning page and clicked at least two explanatory texts, compared to the overall number of this type of email that was sent and clicked.
Calculation
Learning count / Learning page visit count
Impact
A higher Base Learning Rate indicates that users who engage with phishing emails are taking the opportunity to educate themselves and engaging with the learning content, leading to improved long-term awareness. A low rate suggests a need to optimize training visibility and engagement strategies.
